This workshop provides the fundamentals of reversing engineering (RE) Windows malware using a hands-on experience with RE tools and techniques. You will be introduced to RE terms and processes, followed by creating a basic x86 assembly program, and reviewing RE tools and malware techniques. The course will conclude by participants performing hands-on malware analysis that consists of Triage, Static, and Dynamic analysis.
What you'll do
You will be setting up your own malware analysis environment. You will learn to install virtual machine software and set up networking.
What you'll learn
- Setting up a safe virtual malware analysis environment
- Going over operating system and assembly concepts.
- Typical Attack Flow, Malware Classes, and Malware techniques.
- Disassembler, Debuggers, & Information Gathering
- Narrow down specific information and indicators before moving on to deeper static and dynamic analysis.
- How to jump into code in static disassembly then rename and comment on interesting assembly routines that you will debug.
- Deeper analysis of the program to understand hidden functionality not understood statically.
What you'll need
- At least 8 GB of RAM
- At least 40 GB of storage
- Internet connection
Reverse Engineering
"is the process of extracting knowledge or design information from anything man-made and re-producing it or re-producing anything based on the extracted information"[1]
What does it mean to be a reverse engineer?
You can
- Take things apart to figure out how it works
- Love puzzle solving
- Develop experiments and tools
- Think outside the box
- Constantly learn new things
Game Plan
- Determine what are the goals
- Get to just what you need, or
- Know enough to recreate it
- Use reconnaissance and triage skills to determine a target starting point
- Work step by step to get to your goals
- Record your findings through the analysis
Analysis Flow for Malware Analysis
- Setup a baseline analysis environment
- Triage to determine a starting point
- Static Analysis - Get a sense of where everything is before debugging
- Dynamic Analysis - Determine behaviors that can't be understood by static analysis
- Manual Debugging - Stepping through the program to navigate to your goals
In this section you will be setting up a safe virtual malware analysis environment. The virtual machine (VM) that you will be running the malware on should not have internet access nor network share access to the host system. This VM will be designated as the Victim VM. On the other hand, the Sniffer VM will have a passive role in serving and monitoring the internet traffic of the Victim VM. This connection remains on a closed network within virtualbox.
Installing VirtualBox
Click the icons below to download the version of Virtualbox for your OS.
Download Victim and Sniffer VMs
Please use the utility7zip. Unzip the files with 7zip below and in VirtualBox File->Import Appliance targeting the .ova file.
- MD5sum: 83bf0689dae16b209829c675c5828803 Updated 7/23/2019
- OS: Windows 10
- Architecture: Intel 64bit
- Username: Victim
- Password: re1012019
- IP Address: 10.10.10.111
- Gateway: 10.10.10.112
- Zip size 12G, Final size required 23G
- MD5sum: 6ce66037768a4004bd09ffcb8065dc76 Updated 7/23/2019
- OS: Lubuntu 18.04 LTS
- Architecture: Intel 64bit
- Username: Sniffer
- password re1012019
- IP Address: 10.10.10.112
- Gateway: 10.10.10.112
- Zip size 2.5G, Final size required 7G
Post Install Instructions
- Install VirtualBox CD on both VMs: Devices->Insert Guest Additions CD Image
- If it doesn't auto appear, navigate to the CD Drive to install
- Follow install directions from the Guest Additions Dialog
- Note: it will require install privileges so insert passwords for each VM
- Shutdown Both VMs after you have installed the Guest Additions CD.
- Victim VM: Devices->Drag and Drop->Bidrectional
- Victim VM: Devices->Shared Clipboard->Bidirectional
- Both VMs: Devices->Network->Network Settings
- Select Attached to
Internal Network - Name should mirror both VMs. Default is
intnetchange it tore101net
- Run/Play both VMs to verify network connectivity
- Important While running, take a snapshot of each VM and name each "Clean". This will save a clean slate for you to revert the VM image back to.
- Victim VM: Disable Windows Defender Runtime
- Windows Security ->Virus and Threat Detection(left panel) ->Virus and Threat Detection Settings -> Manage Settings -> Toggle Real Time Protection
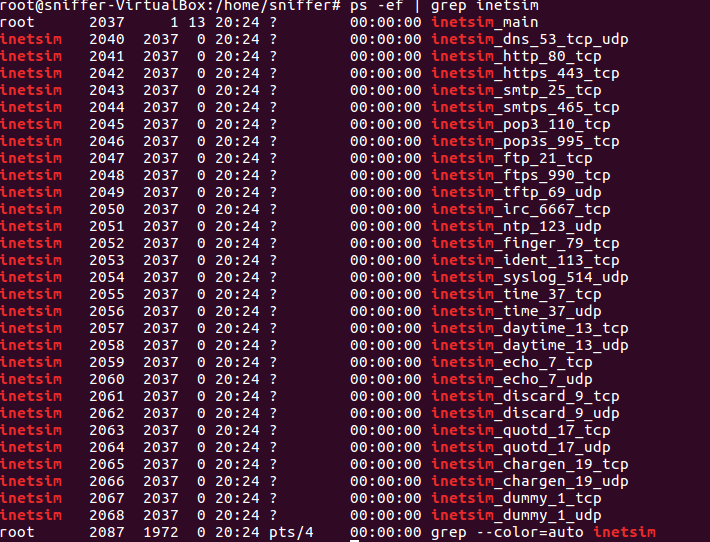
- Sniffer VM: Ensure inetsim is running
- Open terminal and run:
ps -ef | grep inetsim - If no output, run:
/etc/init.d/inetsim start - Run the ps command again to confirm it's running.
- Victim VM: test connection to Sniffer VM
- In the search bar, type cmd.exe to open terminal
- Run command:
ping 10.10.10.112
- Sniffer VM: Devices->Shared Folders->Shared Folders Settings
- On your Host, create a folder called
sniffershare - In virtual box select Add New Shared Folder icon and navigate to the folder you just created (sniffershare)
- In Sniffer VM, open the terminal and run command:
mkdir ~/host; sudo mount -t vboxsf -o uid=$UID,gid=$(id -g) sniffershare ~/host
|
|
Typical windows programs are in the Portable Executable (PE) Format. It's portable because it contains information, resources, and references to dynamic-linked libraries (DLL) that allows windows to load and execute the machine code.
Windows Architecture
In this workshop we will be focusing on user-mode applications.
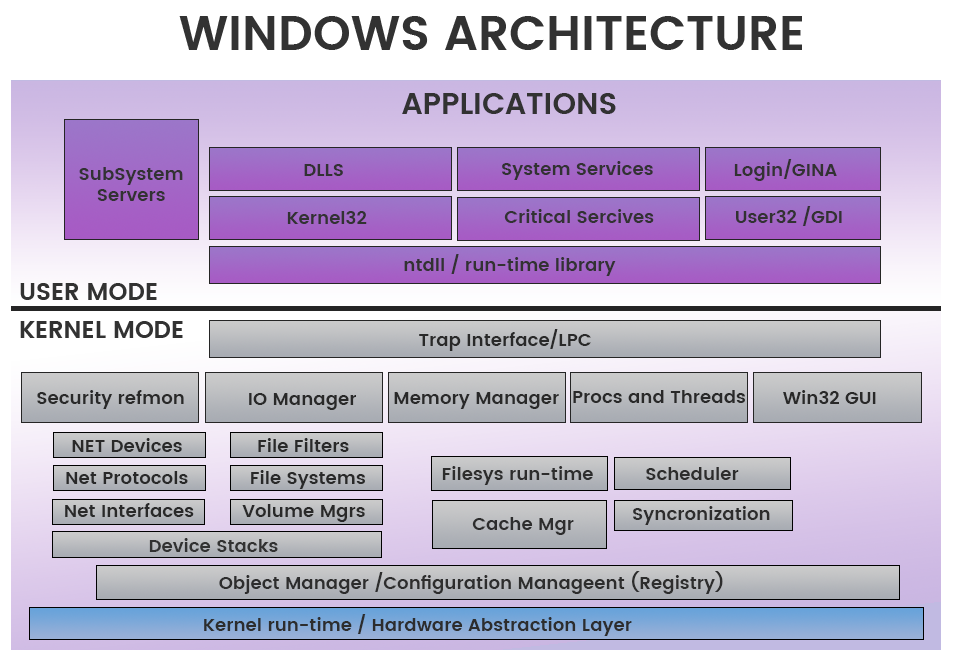
User-mode vs. Kernel Mode [1]
- In user-mode, an application starts a user-mode process which comes with its own private virtual address space and handle table
- In kernel mode, applications share virtual address space.
This diagram shows the relationship of application components for user-mode and kernel-mode.
PE Header
The PE header provides information to operating system on how to map the file into memory. The executable code has designated regions that require a different memory protection (RWX)
- Read
- Write
- Execute
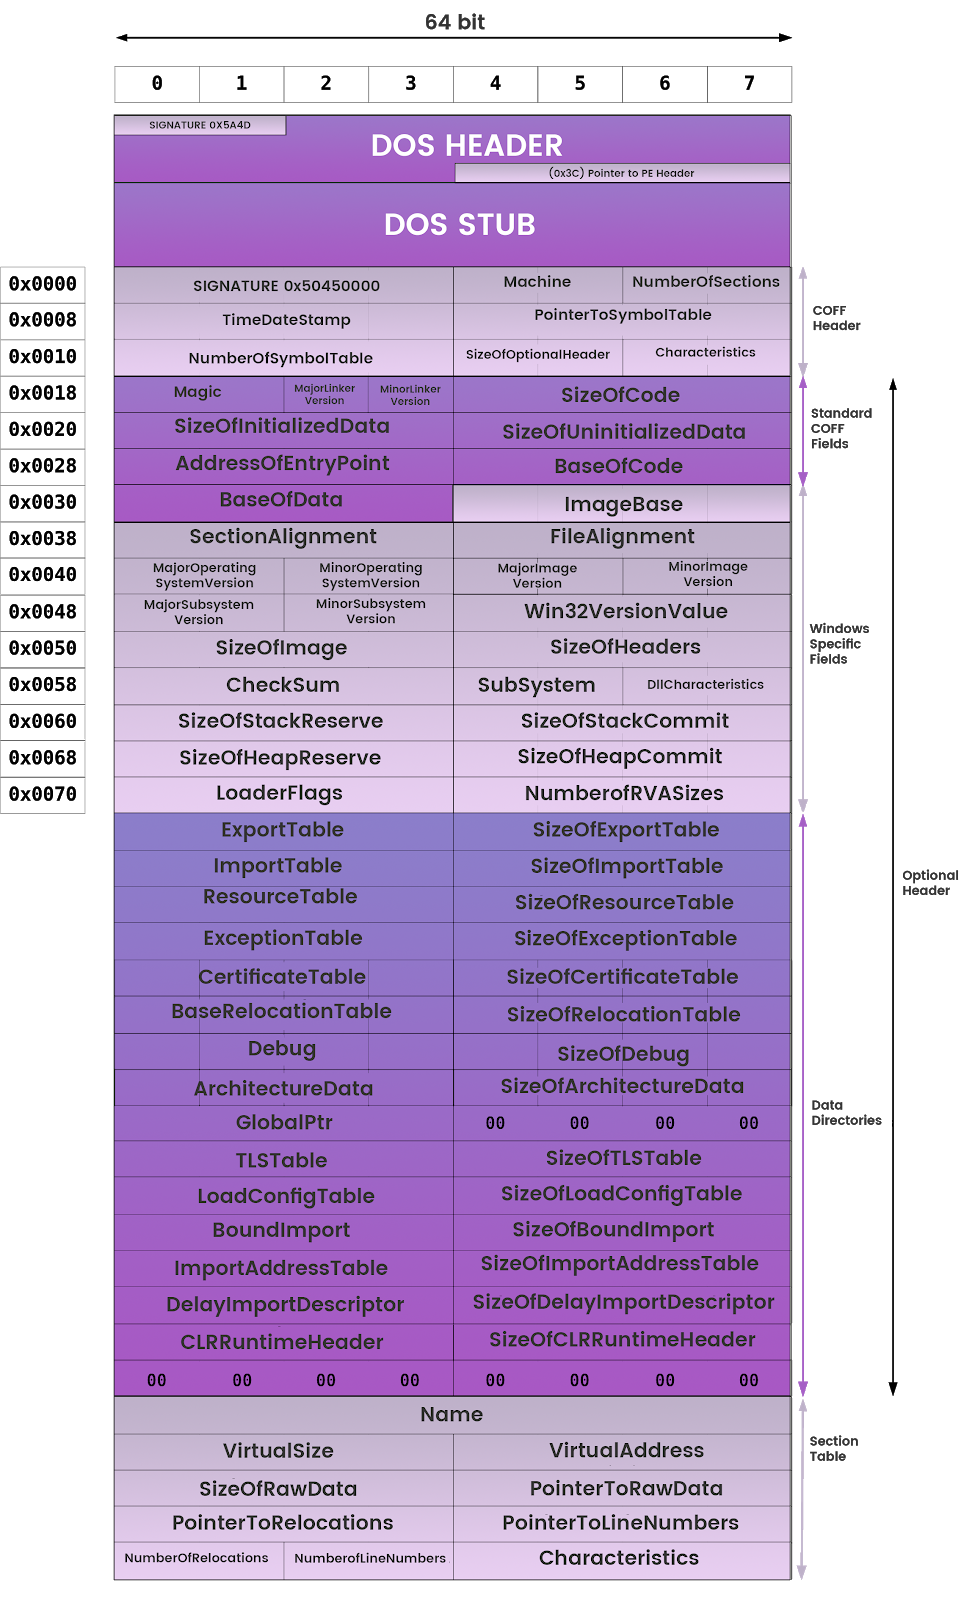
Here is a hexcode dump of a PE header we will be working with.
Memory Layout
- Stack - region of memory is added or removed using "last-in-first-out" (LIFO) procedure[2]
- Heap - region for dynamic memory allocation[3]
- Program Image - The PE executable code placed into memory
- DLLs - Loaded DLL images that are referenced by the PE
- TEB - Thread Environment Block stores information about the current running thread(s)[4]
- PEB - Process Environment Block stores information about loaded modules and processes.[5]
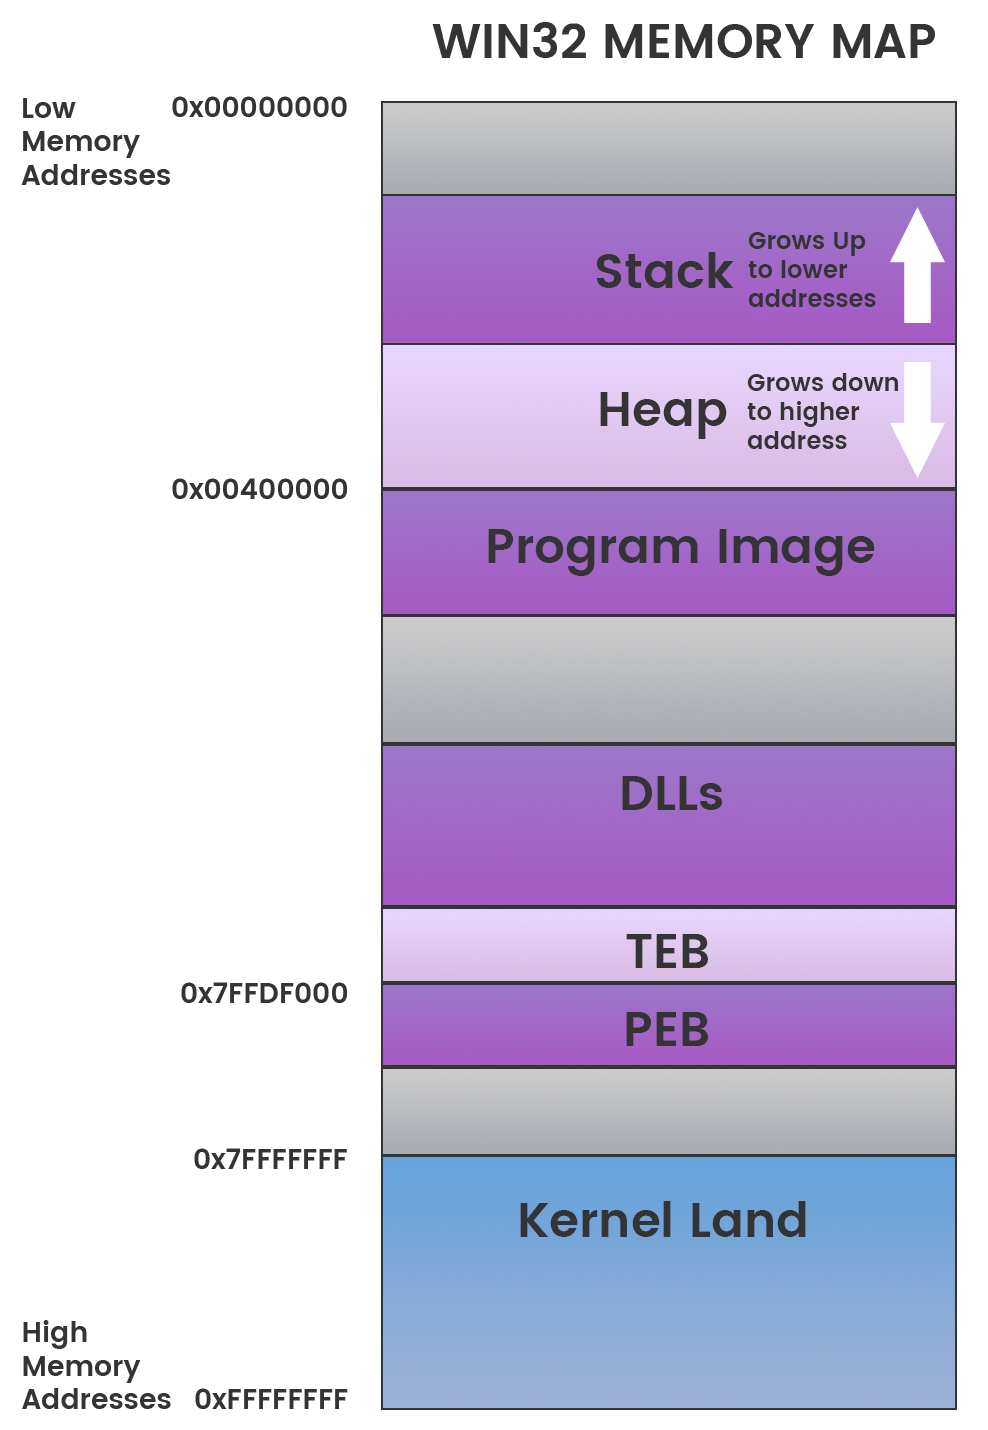
The Stack
- Data is either pushed onto or popped off of the stack data structure
- EBP - Base Pointer is the register that used to store the references in the stack frame
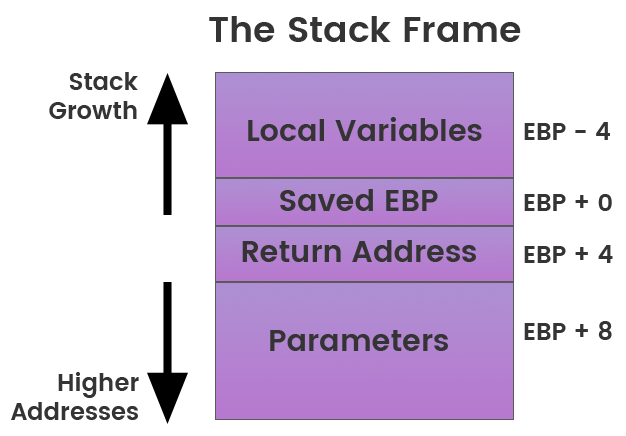
The C programming is a high level language interpreted by the compiler that converts code into machine instructions called assembly language. By using a disassembler tool we can get the assembly language of a compiled C program.
The Intel 8086 and 8088 were the first CPUs to have an instruction set that is now commonly referred to as x86. Intel Architecture 32-bit (IA-32) sometimes also called i386 is the 32-bit version of the x86 instruction set architecture.
The x86 architecture is little-endian, meaning that multi-byte values are written least significant byte first.
How we see it:
| A0 | A1 | A2 | A3 |Stored as Little Endian
| A3 | A2 | A1 | A0 |Opcodes and Instructions
Each Instruction represents opcodes (hex code) that tell the machine what to do next.
Three categories of instructions:
- Data Movement/Access
- Arithmetic / Logic
- Control-Flow
Common Instructions
- mov, lea (data movement, data access)
- add, sub (arithmetic)
- or, and, xor (Logic)
- shr, shl (Logic)
- ror, rol (Logic)
- jmp, jne, jnz, jnb (Control Flow)
- push, pop, call, leave, enter, ret (Control Flow)
Example below is moving value at 0xaaaaaaaa into ecx.
|
|
Registers
General-Purpose Registers [1]
Register | Description |
EAX | Accumulator Register |
EBX | Base Register |
ECX | Counter Register |
EDX | Data Register |
ESI | Source Index |
EDI | Destination Index |
EBP | Base Pointer |
ESP | Stack Pointer |
Instruction Pointer
The EIP register contains the address of the next instruction to be executed.
Segment Registers
Register | Description |
SS | Stack Segment, Pointer to the stack |
CS | Code Segment, Pointer to the code |
DS | Data Segment, Pointer to the data |
ES | Extra Segment, Pointer to extra data |
FS | F Segment, Pointer to more extra data |
GS | G Segment, Pointer to still more extra data |
EFLAGS Registers
ID | Name | Description |
CF | Carry Flag | Set if the last arithmetic operation carried (addition) or borrowed (subtraction) a bit beyond the size of the register. This is then checked when the operation is followed with an add-with-carry or subtract-with-borrow to deal with values too large for just one register to contain |
PF | Parity Flag | Set if the number of set bits in the least significant byte is a multiple of 2 |
AF | Adjust Flag | Carry of Binary Code Decimal (BCD) numbers arithmetic operations |
ZF | Zero Flag | Set if the result of an operation is Zero (0) |
SF | Sign Flag | Set if the result of an operation is negative |
TF | Trap Flag | Set if step by step debugging |
IF | Interruption Flag | Set if interrupts are enabled |
DF | Direction Flag | Stream direction. If set, string operations will decrement their pointer rather than incrementing it, reading memory backwards |
OF | Overflow Flag | Set if signed arithmetic operations result in a value too large for the register to contain |
IOPL | I/O Privilege Level field (2 bits) | I/O Privilege Level of the current process |
NT | Nested Task flag | Controls chaining of interrupts. Set if the current process is linked to the next process |
RF | Resume Flag | Response to debug exceptions |
VM | Virtual-8086 Mode | Set if in 8086 compatibility mode |
AC | Alignment Check | Set if alignment checking of memory references is done |
VIF | Virtual Interrupt Flag | Virtual image of IF |
VIP | Virtual Interrupt Pending flag | Set if an interrupt is pending |
ID | Identification Flag | Support for CPUID instruction if can be set |
Hello World
Calling a Function
Arguments on the Stack
Local Variables on the Stack
Malware Classes
Class | Description |
Virus | Code that propagates (replicates) across systems with user intervention |
Worm | Code that self-propagates/replicates across systems without requiring user intervention |
Bot | Automated process that interacts with other network services |
Trojan | Malware that is often disguised as legitimate software |
Ransomware | Malware that holds the victim's data hostage by cryptography or other means |
Rootkit | Masks its existence or the existence of other software |
Backdoor | Enables a remote attacker to have access to or send commands to a compromised computer |
RAT | Remote Access Trojan, similar to a backdoor |
Info Stealer | Steals victims information, passwords, or other personal data |
HackTool | Admin tools or programs that may be used by hackers to attack computer systems and networks. These programs are not generally malicious |
Hoax | Program may deliver a false warning about a computer virus or install a fake AV |
Dropper/Downloader | Designed to "install" or download some sort of malware |
Adware | Automatically renders advertisements in order to generate revenue for its author. |
PUP/PUA | Potentially Unwanted Program, sometimes added to a system without the user's knowledge or approval |
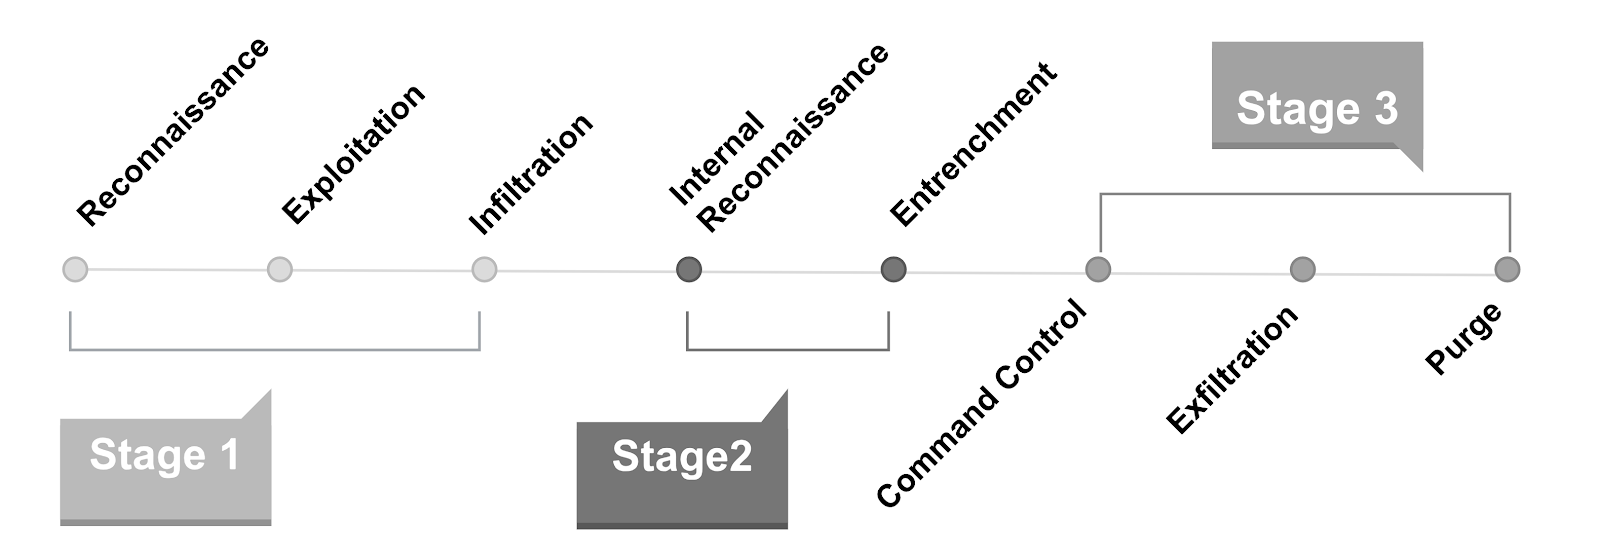
Malware Techniques
The malware classes may exhibit one or more of the following techniques.Mitre Att&ck framework provides a great reference for many of these techniques.
Compression
Combining the compressed data with decompression code into a single executable
- Runtime packers
- Self extractive archives
List of packers
Obfuscation
- Deliberate act of creating obfuscated code that is difficult for humans to understand
- Plain text strings will appear as base64 or Xor
- Malicious behavior will include junk functions or routines that do nothing to throw off the reverser.
- Control-Flow Flattening
- String Encryption
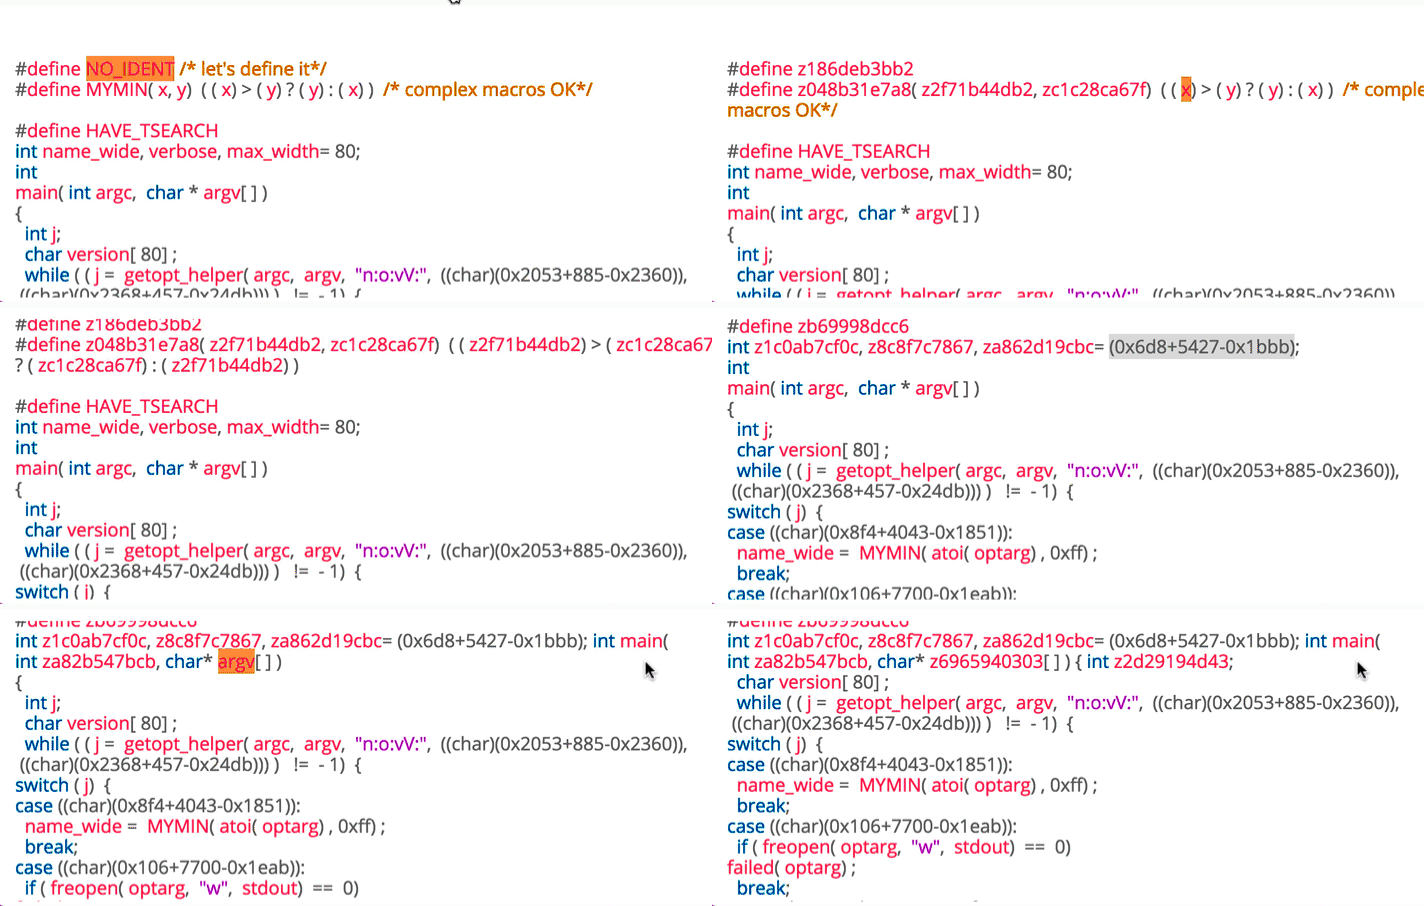
Sample & Link:virustotal
f4d9660502220c22e367e084c7f5647c21ad4821d8c41ce68e1ac89975175051
Persistence
- Once malware gains access to a system, it often looks to be there for a long time.
- If the persistence mechanism is unique enough, it can even serve as a great way to identify a given piece of malware.
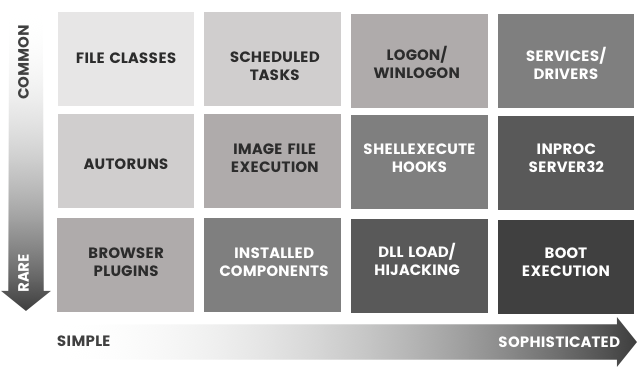
Sample & Link: virustotal
cb07ec66c37f43512f140cd470912281f12d1bc9297e59c96134063f963d07ff
Privilege Escalation
- Exploiting a bug, design flaw or configuration oversight in an operating system or software application to gain elevated access to resources that are normally protected from an application or user.
- Common Techniques:
- Dll Search Order Hijacking
- Dll injection
- Exploiting a vulnerability
- BufferOverflow
- StackOverflow
- Heapspray
- Return Orientated Programming (ROP)
- Credential Theft
- UAC Bypasses
Defense Evasion
- Evading detection or avoiding defenses.
- Common Techniques:
- Killing AV
- Deleting itself after a run
- Timebombs/Timestomping
- Stolen Certificates
- Dll Side Loading
- Masquerading
- Process Hollowing
- Code Injection
Credential Theft
- Going after password storage
- Keylogging passwords
- Screenshots
Reconnaissance
- Gain knowledge about the system and internal network.
Lateral Movement
- Enable an adversary to access and control remote systems on a network
Execution
- Techniques that result in execution of adversary-controlled code on a local or remote system
- scripts
- post-exploitation
Collection
- Identify and gather information, such as sensitive files, from a target network prior to exfiltration
Exfiltration
- Removing files and information
Command and Control
- Communicate with systems under their control
Disassemblers
Debuggers
Decompilers
Information Gathering
- CFF Explorer - PE header parser (Used in this workshop)
- PE Explorer - PE inspection tool (Used in this workshop)
- BinText - Extract string from a binary
- Sysinternals Suite (Used in this workshop)
- procmon
- procexplorer
- InetSim: Internet Services Simulation Suite (Used in this workshop)
- Yara: pattern matching rule engine
- Wireshark - network sniffing (Used in this workshop)
- API Monitor
Helpful Websites
- virustotal.com - free service that analyzes suspicious files and URLs
- malwr.com - Malwr is a free malware analysis service
- hyrbid-analysis - free malware analysis service
- whois.domaintools.com - look up domains
- robtex.com - free DNS lookup tool
- www.debuggex.com - Online Visual Regex Tester
Support
- HxD Hex Editor (Used in this workshop)
- Python - used for automating tasks
Tools Used in the Workshop
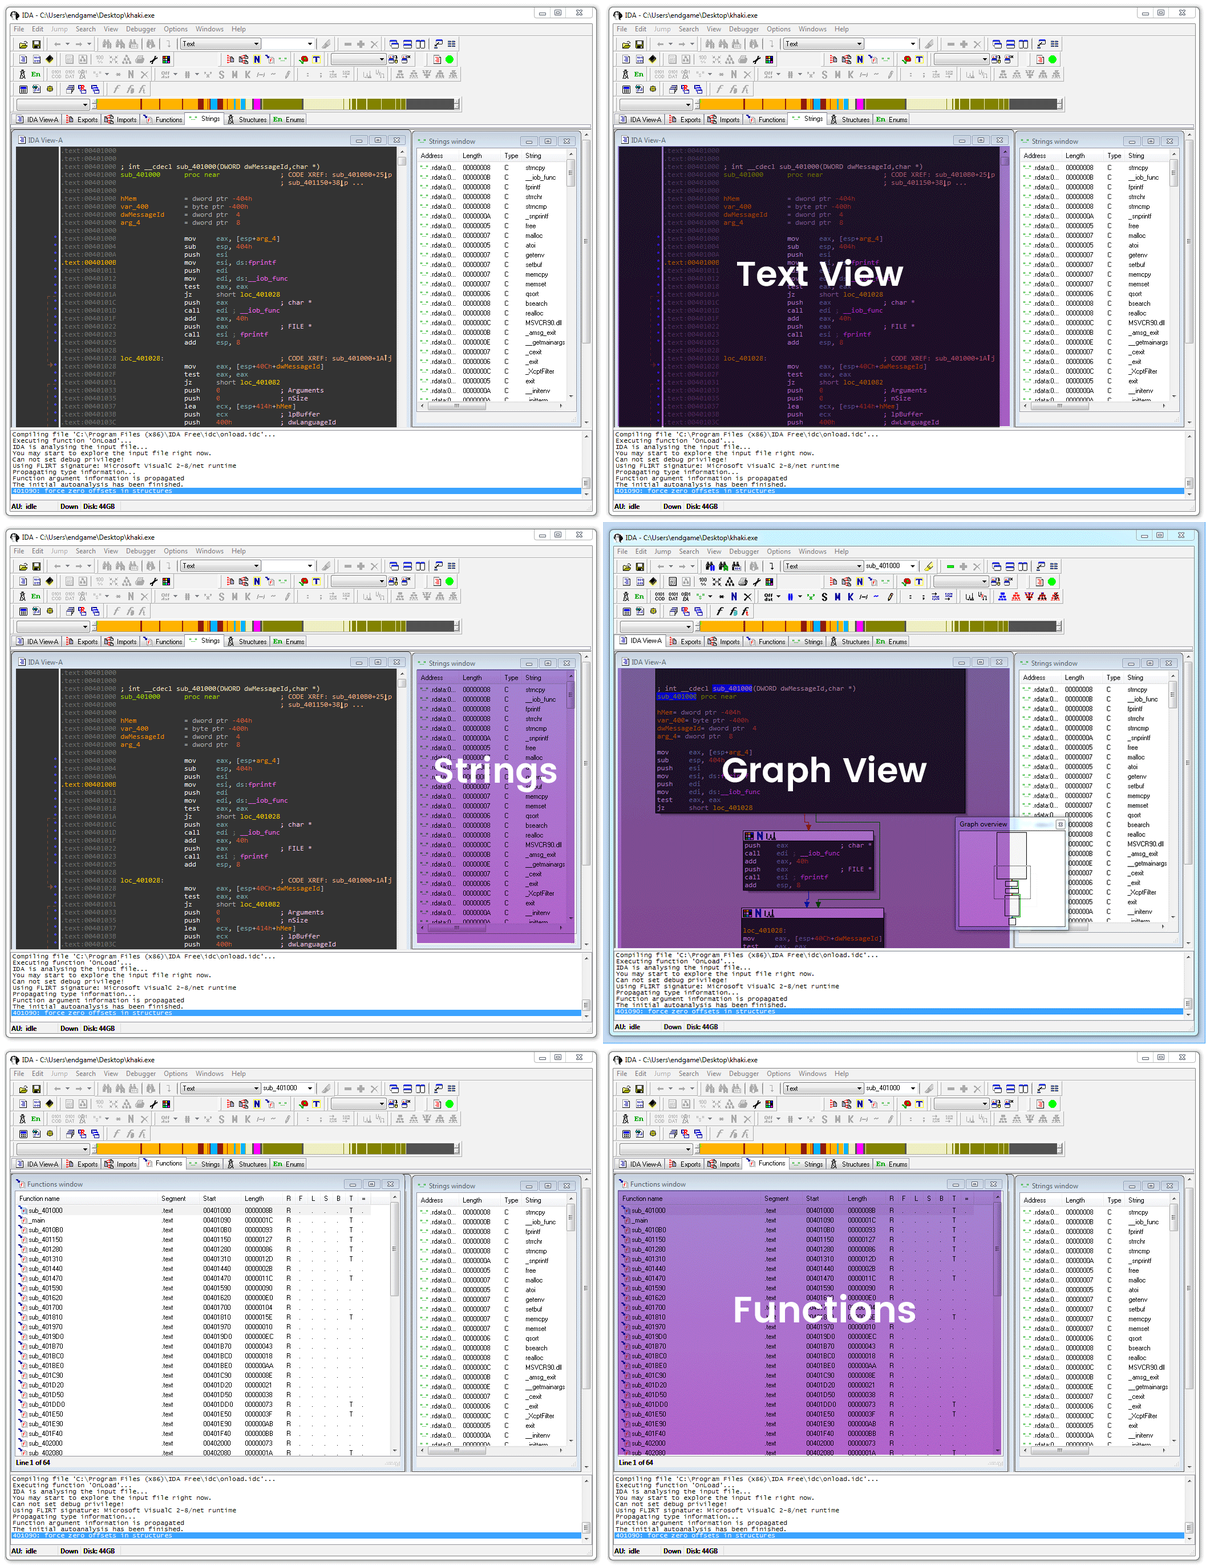
Disassembler: IdaFree
- Visual Modes
- Graph Mode - control flow diagram
- Text Mode - default view of disassembled code
- Command Cheatsheet
- Please refer to thisIda cheatsheet
- Common Commands
Action | Command |
Jump to xref to operand | X |
Jump to address | G |
Enter comment | Shift+; |
Debugger: x64dbg
Common Commands
Action | Command |
Enter comment | ; |
BreakPoint | F2 |
Step into | F7 |
Step over | F8 |
Run | F9 |
Edit Instruction | Space |
Keyboard Layout for IdaFree and x64dbg
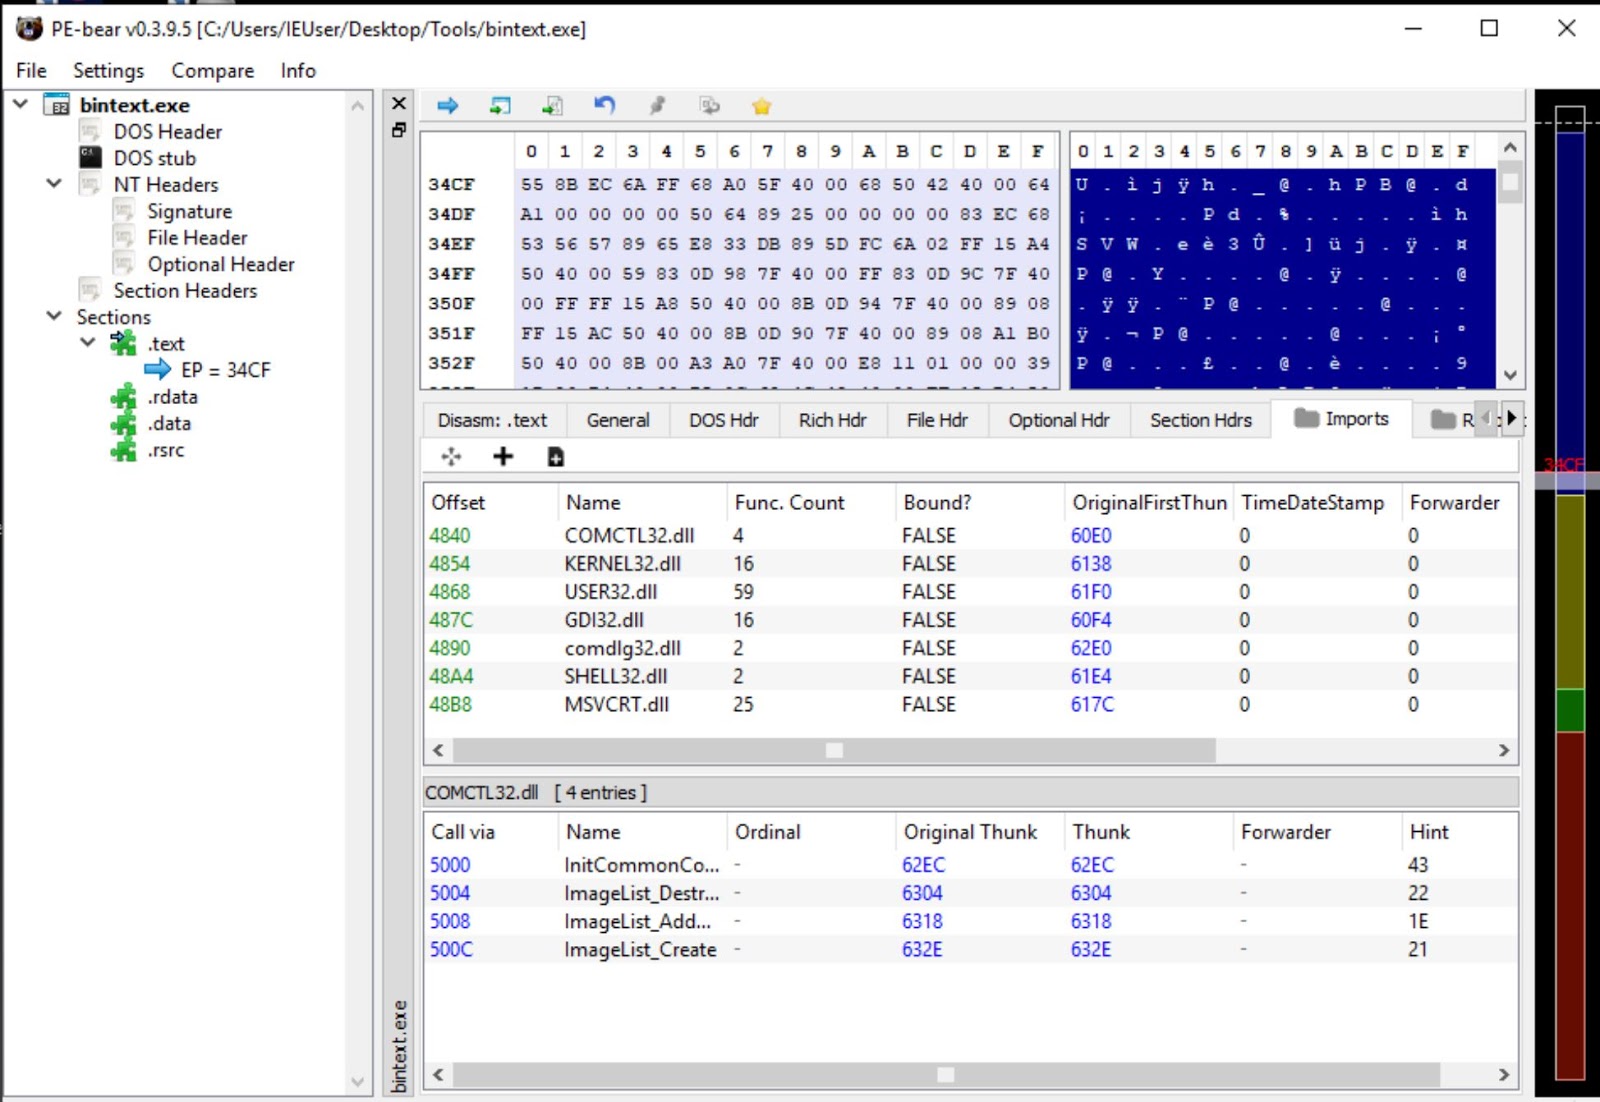
Information Gathering: PE Bear
- Parses the PE headers
- Explores Resources
- Unpacks UPX
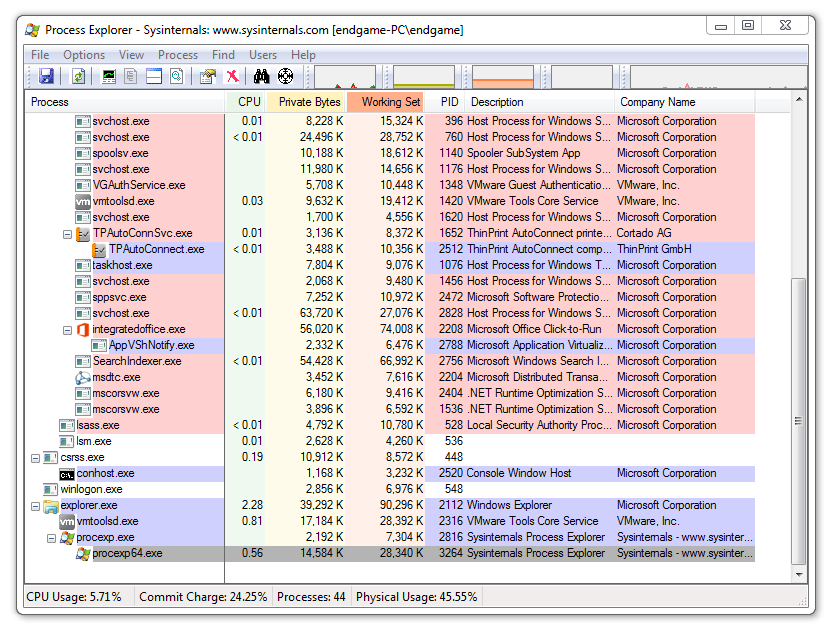
Information Gathering: Sysinternals Suite
- advanced system utilities
- ProcMon - Monitor processes/thread, files system, network, and registry activity on the system
- ProcExp - Monitor processes running on the system
Depending on your workload, you want to spend the least amount of time trying to determine what the malware is doing and how to get rid of it. Many malware analysts use their own triage analysis, similar to that in the Emergency Room at the hospital.
You will want to quickly narrow down specific information and indicators before moving on to deeper static and dynamic analysis.
This checklist should get you started:
- File Context and Delivery
- File Information & Header Analysis
- Get Basic PE information
- Simple Search
- Collect Strings
- Check AV vendors
- Quick VM Detonation
- Capture network information
File Context and Delivery
When you receive the malware binary, it's important to ask how the malware got there in the first place.
Questions to ask:
- Did it come from an email?
- Did it come from a browser download?
- Was it quarantined in an Anti-Virus?
- Is it an anomalous process running?
File Information & Header Analysis
- Use a file command (sniffer VM) to determine the file type
- Verify the file header using a hex editor (HxD)
Get Basic PE information
- Parse the PE header using the tool PE Bear
- Determine what resources, DLL imports, and libraries used
- Example: If you see Ws2_32.dll it might be setting up a network connection because it's used for setting up sockets
Simple Search
- Calculate the hash of the file and check the web to see if it's been seen already
Collect Strings
- Using the string command in linux or BinText tool, extract the strings to find any clues
Check AV vendors
- Run the file against an Anti-Virus or VirusTotal to see if there are any detections
Quick VM Detonation
- Use open source VM detonation services like hybrid-analysis.com or malwr.com to get the behavior quickly
Capture network information
- Use the VM detonation service to capture any network connections or packet data.
- If you can't do this then we will need to dynamically debug the malware.
Start the Victim VM
Copy over the Unknown binary file to the Victim VM's Desktop
Check the file header
Open the file in the hex editor HxD
Notice the first 2 bytes are MZ meaning it's a PE Binary
00000000: 4d5a 9000 0300 0000 0400 0000 ffff 0000  MZ..............
00000010: b800 0000 0000 0000 4000 0000 0000 0000  ........@.......
00000020: 0000 0000 0000 0000 0000 0000 0000 0000  ................
00000030: 0000 0000 0000 0000 0000 0000 d800 0000  ................
00000040: 0e1f ba0e 00b4 09cd 21b8 014c cd21 5468  ........!..L.!Th
00000050: 6973 2070 726f 6772 616d 2063 616e 6e6f  is program canno
00000060: 7420 6265 2072 756e 2069 6e20 444f 5320  t be run in DOS
00000070: 6d6f 6465 2e0d 0d0a 2400 0000 0000 0000  mode....$.......
00000080: e34b 539a a72a 3dc9 a72a 3dc9 a72a 3dc9  .KS..*=..*=..*=.
00000090: bcb7 a3c9 a62a 3dc9 bcb7 97c9 a12a 3dc9  .....*=......*=.
Check the PE header information
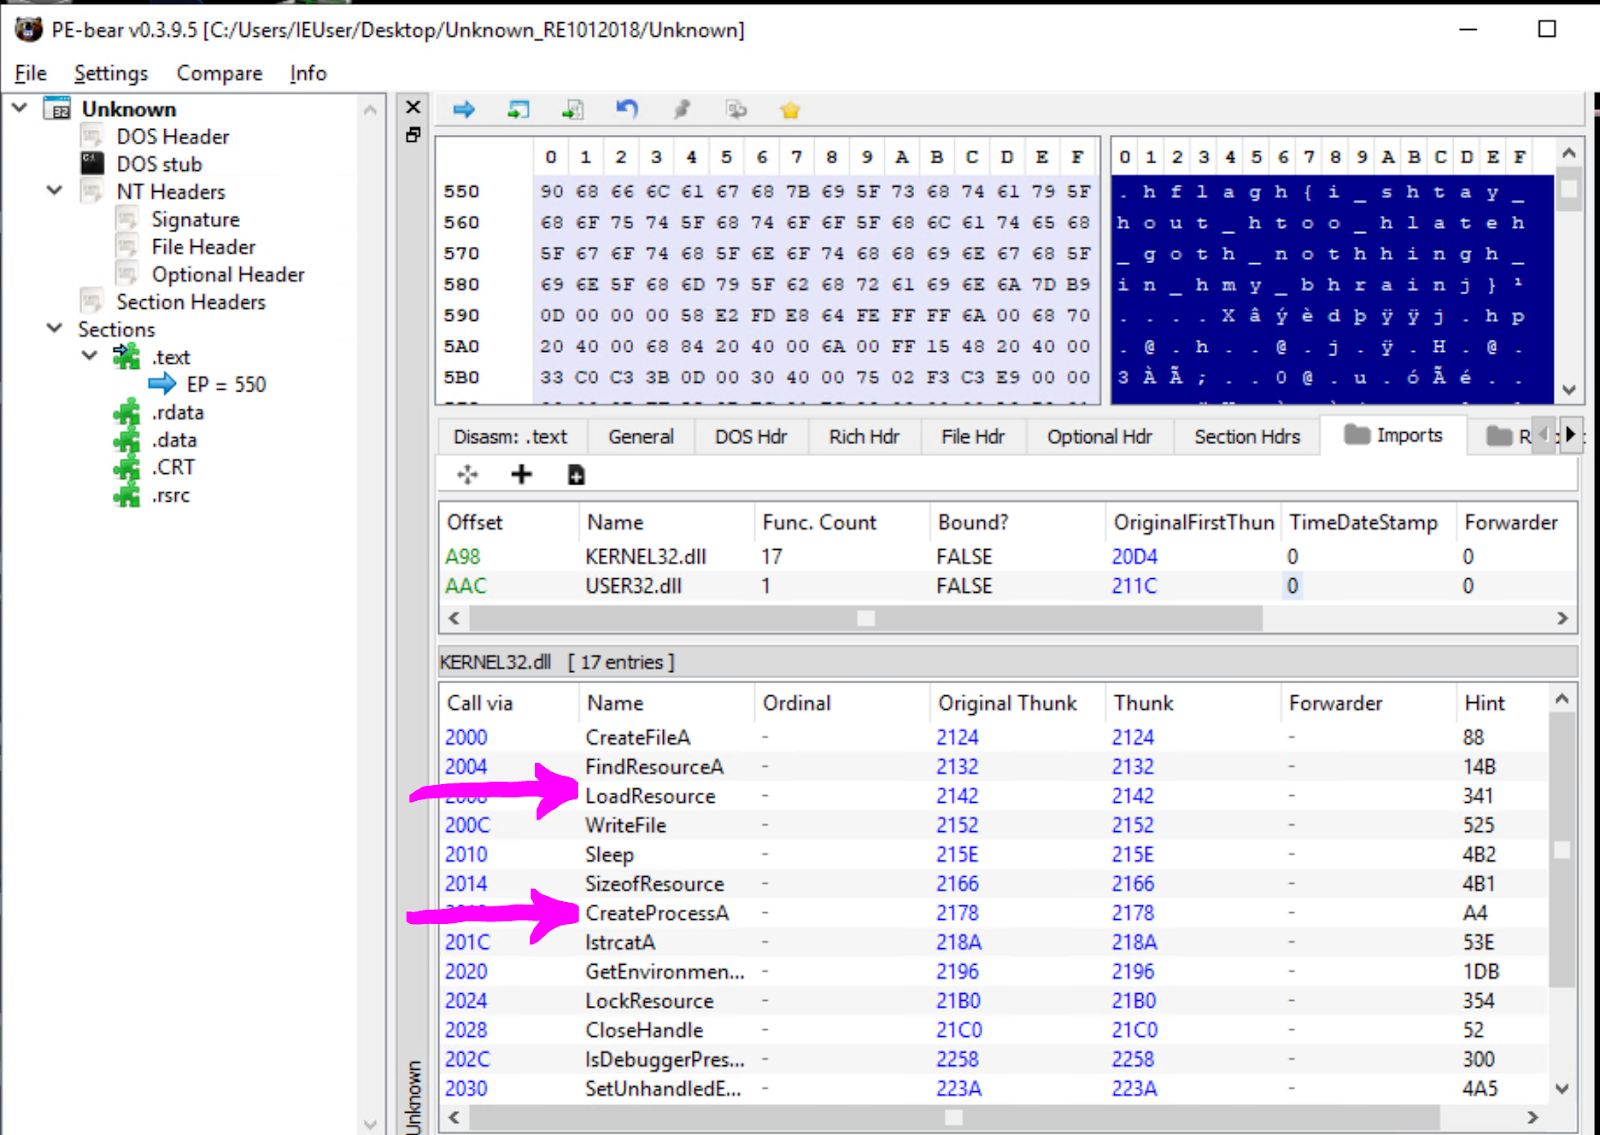
Add the file extension .exe to the Unknown file so that it reads as Unknown.exe. Load the file in PE Bear to check the PE header information.
- Select the Import Directory in the navigation tree
- Notice that is usingFindResourceA andCreateProcessA. This means the executable might be extracting something out of the resource section and run it as a new process.
Collect the MD5 hash
Select the File information in the PE Bear navigation tree to collect the MD5 hash and SHA1 Hash.
Go tovirustotal.com and search based on hash. See if there are any search results.
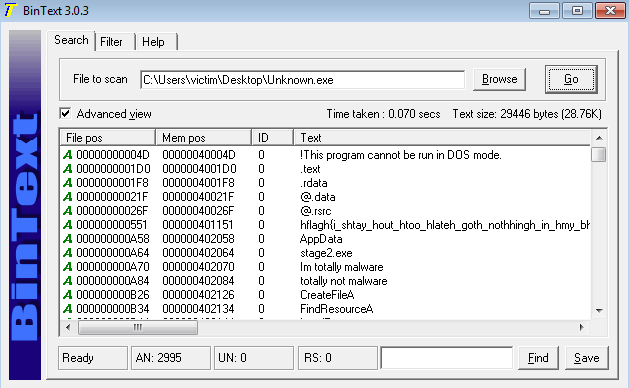
Open the file in BinText
Next open the file in BinText program and note any interesting strings.
Quick Detonation
The point of the quick detonation is to capture the filesystem, registry, and connection activity. The VMs are set up in such a way that the Victim VM's internet traffic is captured by the Sniffer VM.
- Besure you are running both the Sniffer VM & Victim VM
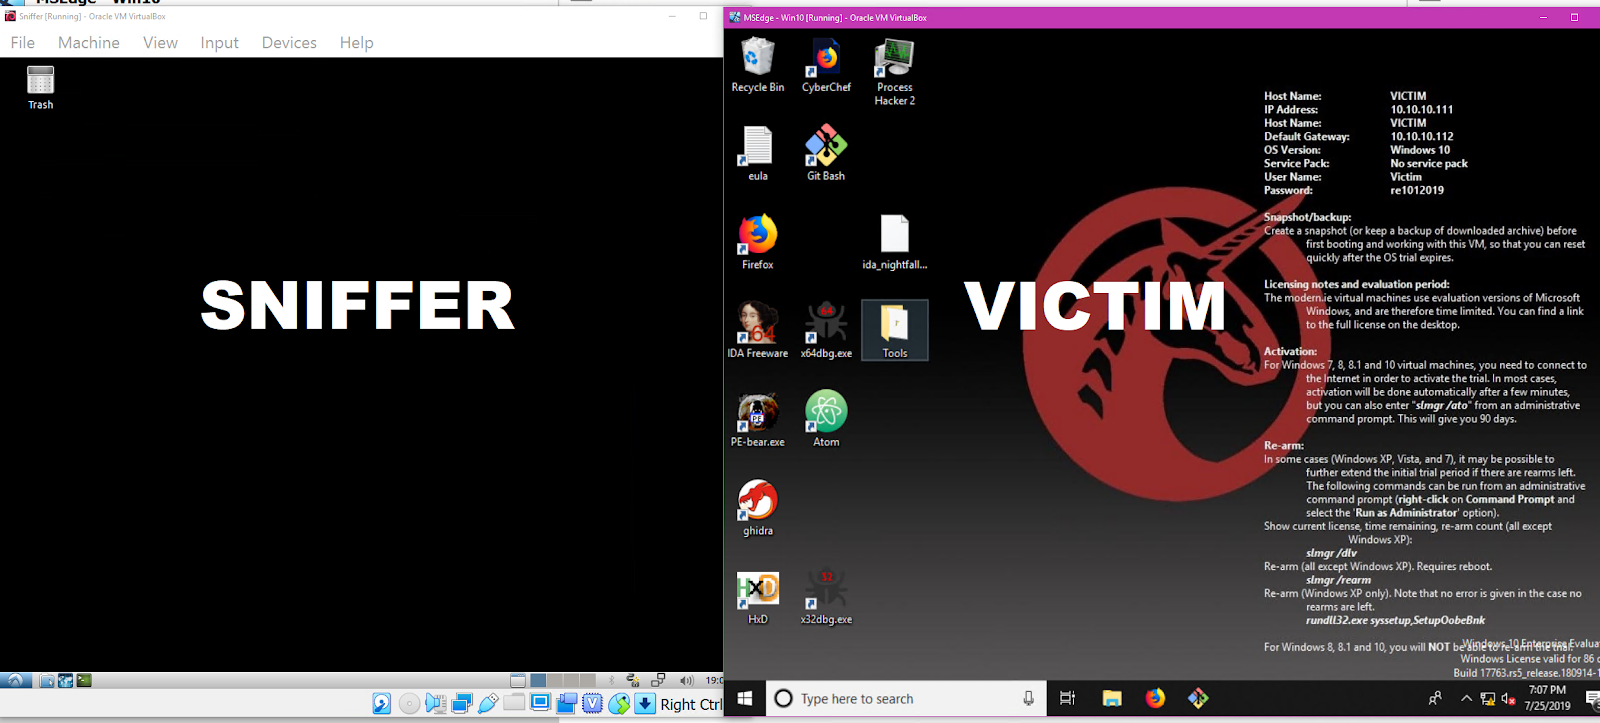
- On the Sniffer VM open the terminal and run
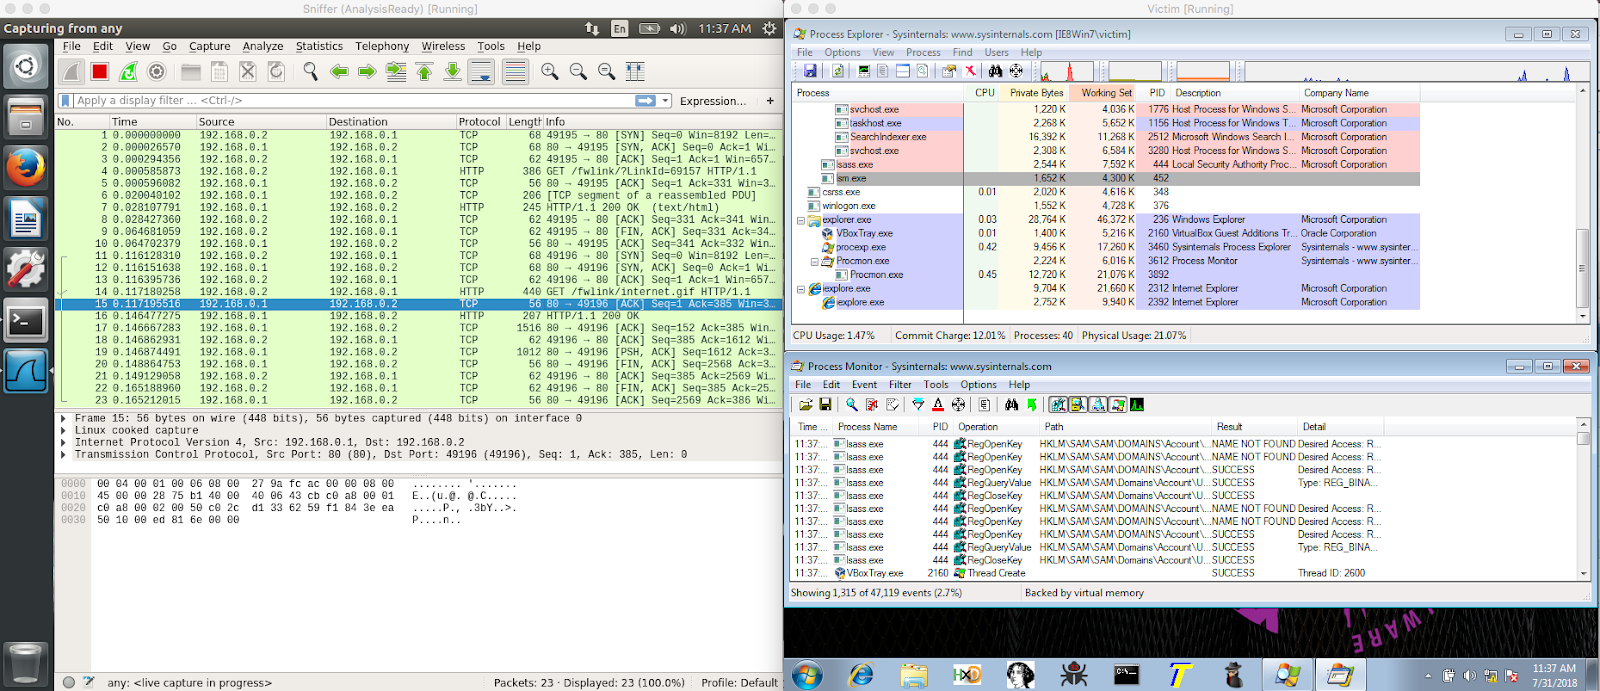
sudo wiresharkto get Wireshark sniffing the traffic from the Victim VM. In the menu select "any" for the interface to monitor. Be sure InetSim is still running, see the fundamentals section on how to start up InetSim. - On the Victim VM go to the Desktop->Tools->SysInternalsSuite and open procmon.exe and procexp.exe so that we can monitor filesystem and process events.
- If you open internet explorer on the Victim Vm you should be able to see the InetSim test page.
- You should see communication between IP addresses 10.10.10.111 (Victim) and 10.10.10.112 (Sniffer)
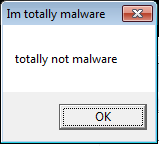
Open a new windows cmd.exe terminal and run the Unknown.exe

You should see an interesting popup in the Victim VM
Look at network activity in Wireshark
You should see some interesting network activity in Wireshark in the Sniffer VM.
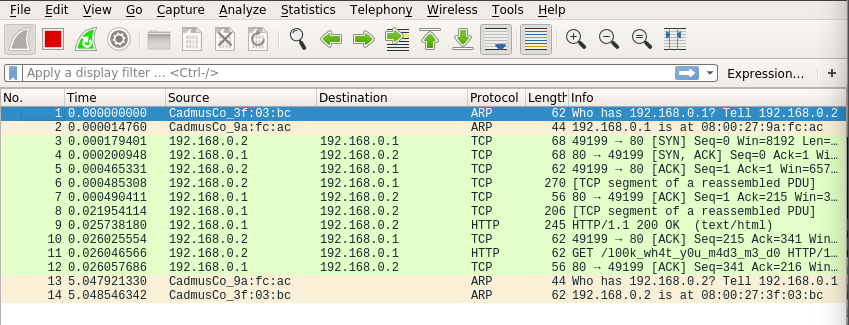
In Wireshark, find the Protocol HTTP where the info contains GET /l00k_wh4t_y0u_m4d3_m3_d0
Right click and Follow->TCP Stream. It will display the HTTP get request that was sent by the Unknown.exe
Stop the monitoring in procmon.exe
Stop the monitoring in procmon.exe File->Capture Events
- In procmon.exe you can filter
- [Process Name] [is] [Unknown.exe]
- [Operation] [is] [CreateFile]
The filter should show that there was a file created in C:\Users\victim\AppData\Roaming\stage2.exe
Summarize all the Details
Summarize all the interesting details in your notes. You will use these details in the next section
So far the assumptions you can make:
- It might be starting a new process
- It might be extracting something out from it's resources
- It has an internet HTTP GET request to
definitely-not-evil.com/l00k_wh4t_y0u_m4d3_m3_d0 - It creates a file called stage2.exe
- It has a message box that says totally not malware
Static analysis is like reading a map for directions on where to go. As you follow through this map you capture notes on what things might look interesting when you actually begin your journey.
This section will teach you how to jump into code in static disassembly then rename and comment on interesting assembly routines that we will debug in the last section.
Open Unknown.exe in IDA
You should see a control flow graph view of the start function. To see the text view, hit your space bar to toggle the views.
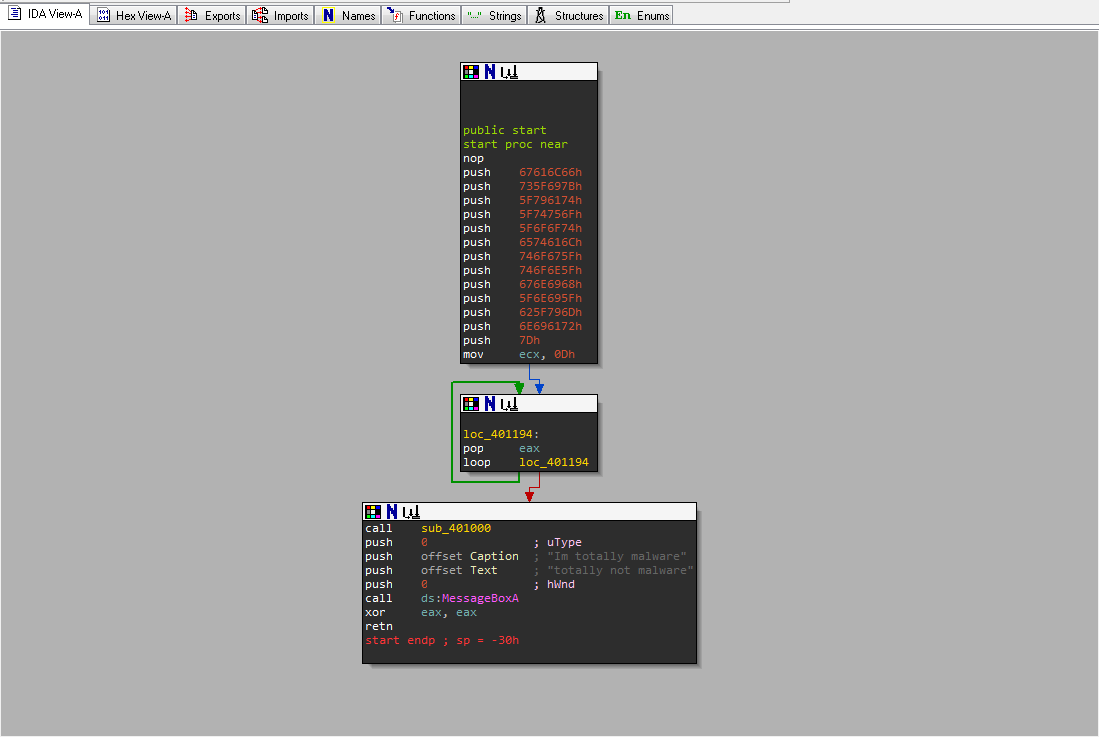
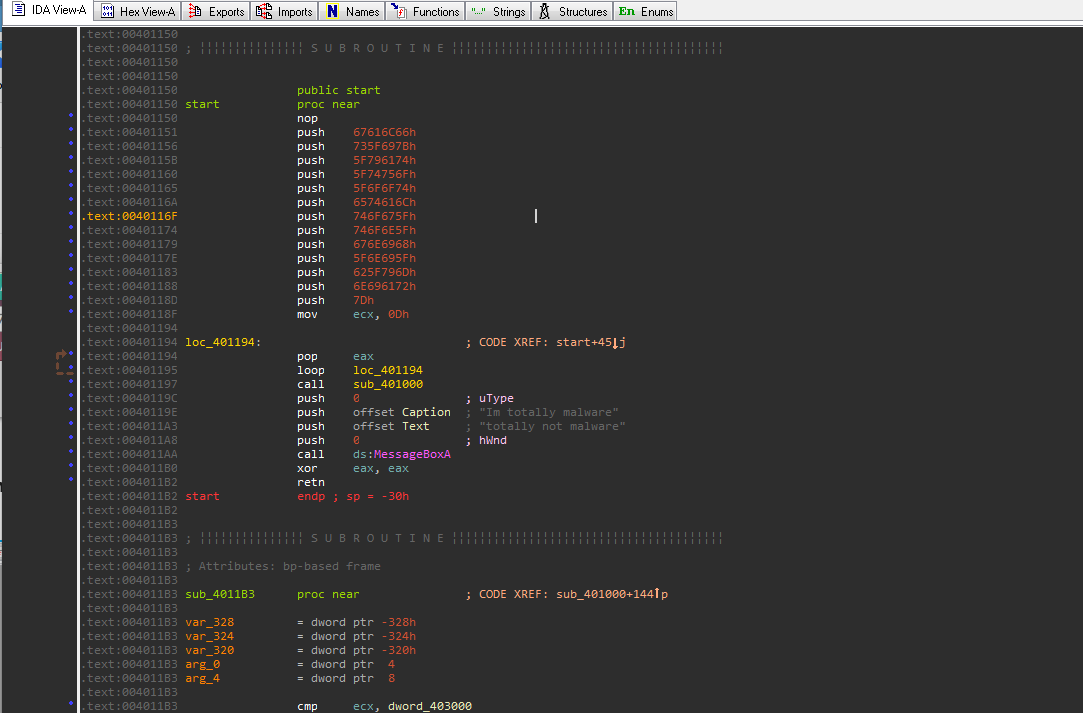
String Anti Analysis
Notice that the function is using many push instructions. This is a technique used by malware authors to hide strings on the stack. Remember that values are in little endian format so each Hex value will appear backwards.
- Right click on the value of one of those pushes (i.e.
67616C66h) and select the R for the readable string option. 67616C66hwill begalfin ascii text- Convert all the values of all the sequential pushes from offset
00401151to00401188 - This will be our first Flag
Next, go to the Strings Tab
- Look for interesting strings you recognize from the triage analysis. For example let's use stage2.exe
- Double click on the string stage2.exe and it will take you to where the string exists in the executable image
- Now you will need to find out which code is referencing this string. Place your cursor on it's reference label
aStage_exeand hit the X key. This will open a window that will show all of the code locations that reference this string. - In the xrefs menu, select the address to
sub_401000. This will take you to where the string is referenced at004010B0.
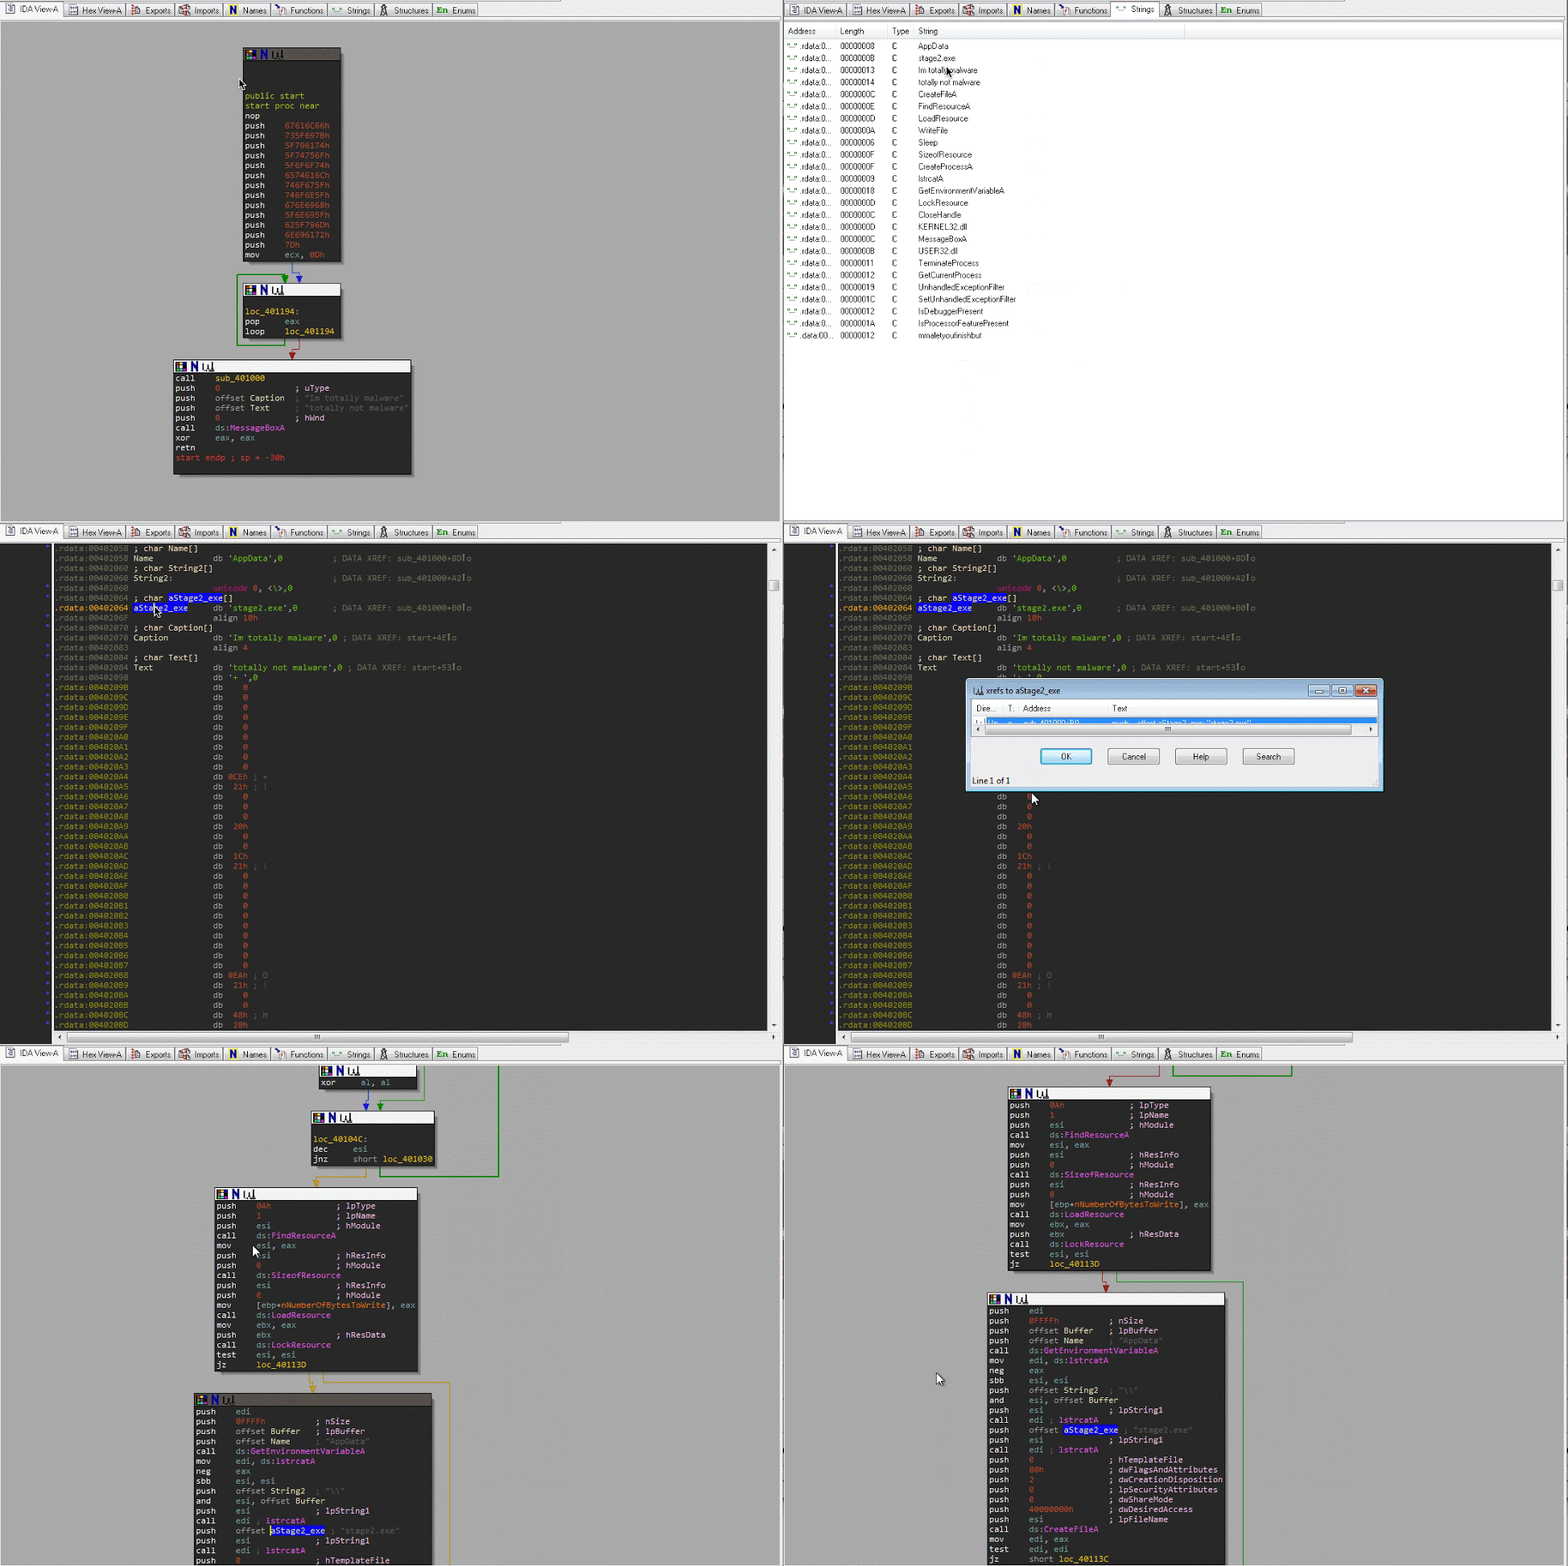
Trace back to the Start function
You will need to create record the route from the start function to the current position you are at. To do this you will need to follow the xrefs of the functions backwards until you reach the start function.
- In the text view, scroll up to the first location label
loc_40104C. Place cursor on the function name and hit the X key to follow the code which branches to this location (A branch or jump instruction is jbe or jmp). - Keep doing this until you reach the beginning of the current function which is at offset
00401000. - You will need to keep track of where these branch statements occur as apart of the flow.
- Place cursor on the function name and hit the X key. Select the first function you see which is the Start function.
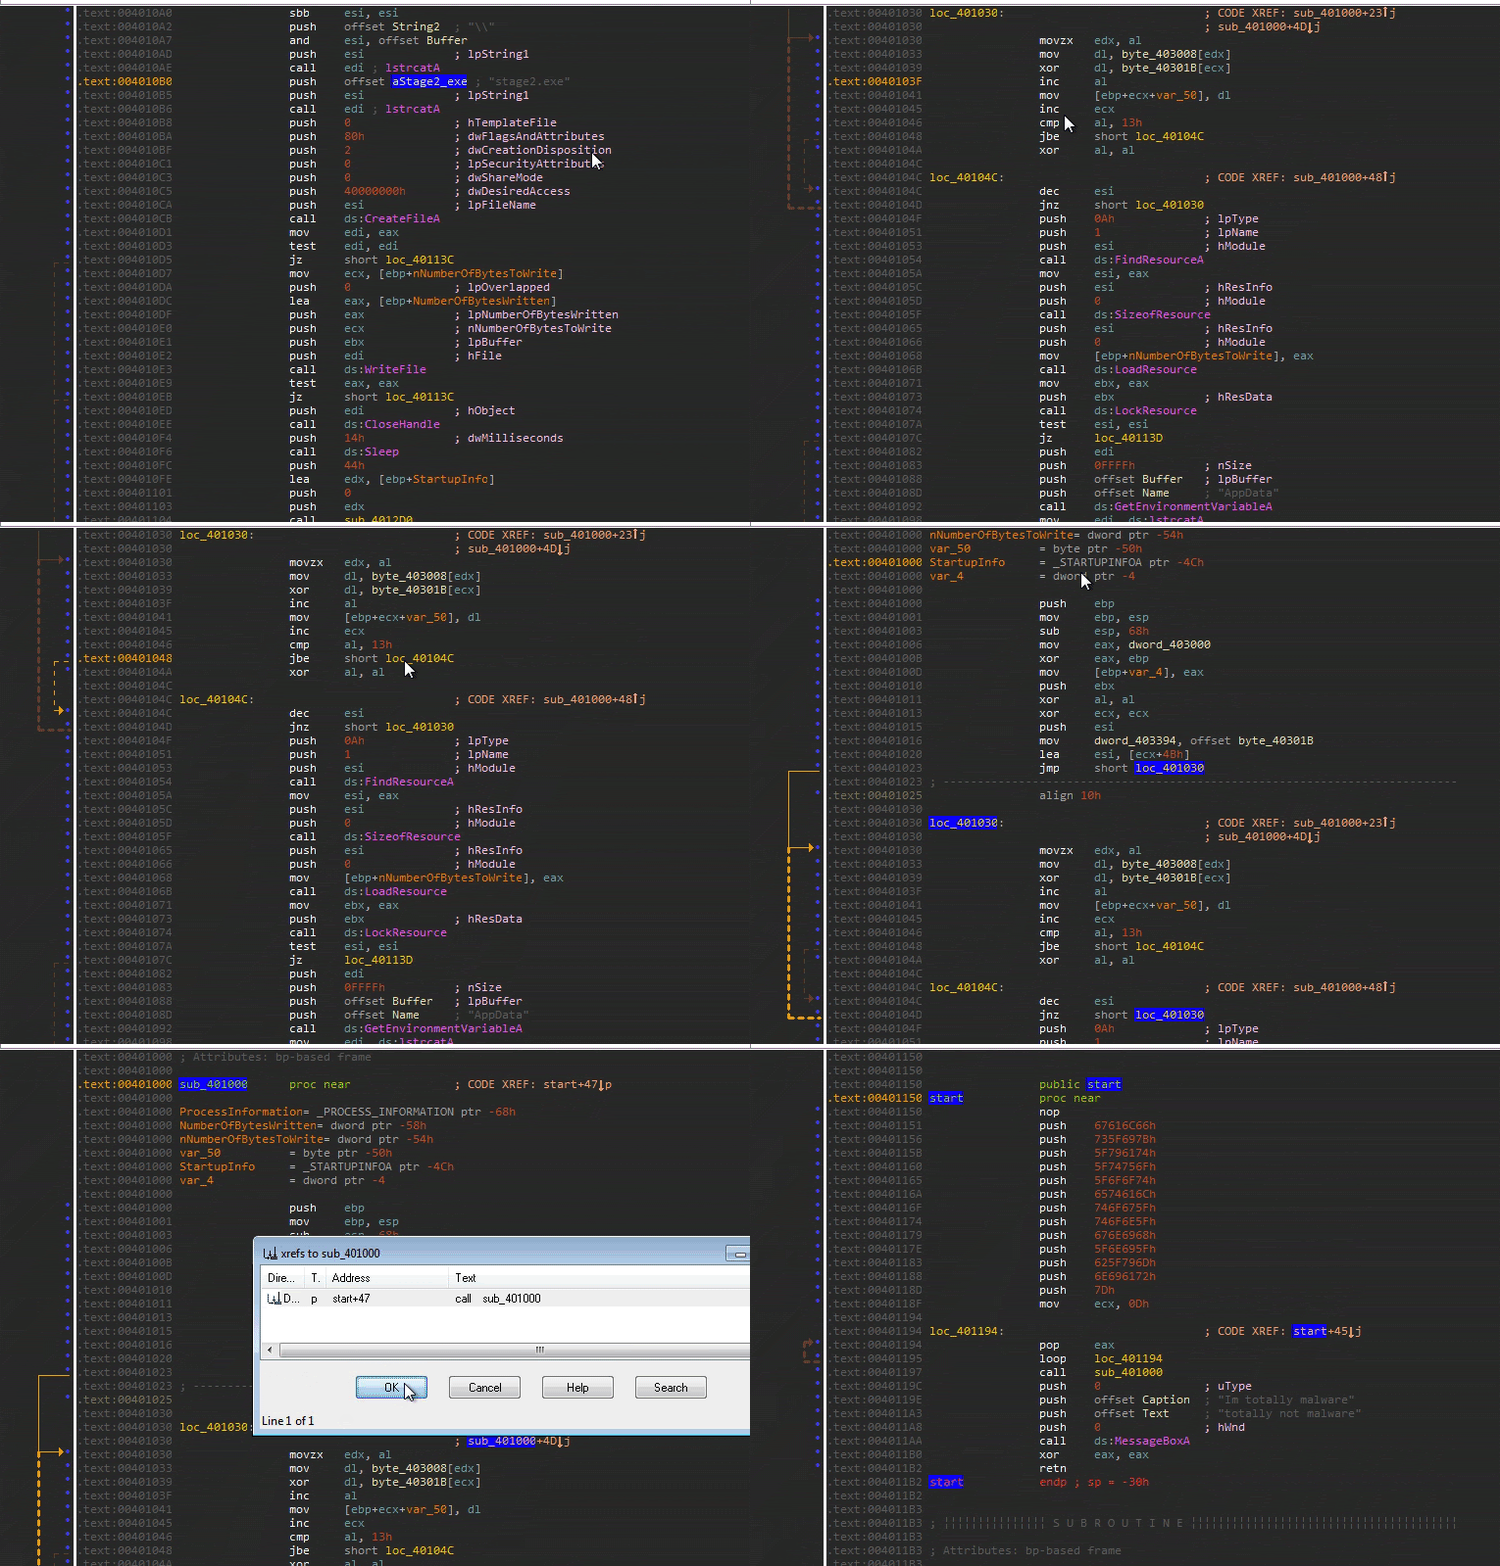
Analyze function sub_401000
So it looks like you need to capture when stage2.exe file is created and written. Remember that functions have their arguments pushed onto the stack before the function is called.
In the excerpt below, the string for stage2.exe is concatenated together with the string referenced by the register esi. Then esi is used as the first argument for CreateFileA.
C function
HANDLE CreateFileA(
 LPCSTR                lpFileName, // Arg1
 DWORD                 dwDesiredAccess, // Arg2
 DWORD                 dwShareMode, //Arg3
 LPSECURITY_ATTRIBUTES lpSecurityAttributes, //Arg4
 DWORD                 dwCreationDisposition, //Arg5
 DWORD                 dwFlagsAndAttributes, //Arg6
 HANDLE                hTemplateFile //Arg7
);
Assembly
.text:004010B0                 push    offset aStage2_exe ; "stage2.exe"
.text:004010B5                 push    esi             ; lpString1
.text:004010B6                 call    edi ; lstrcatA
.text:004010B8                 push    0               ; Arg7 hTemplateFile
.text:004010BA                 push    80h             ; Arg6
.text:004010BF                 push    2               ; Arg5
.text:004010C1                 push    0               ; Arg4
.text:004010C3                 push    0               ; Arg3 dwShareMode
.text:004010C5                 push    40000000h       ; Arg2 dwDesiredAccess
.text:004010CA                 push    esi             ; Arg1 lpFileName
.text:004010CB                 call    ds:CreateFileA
Also notice further down the function, the esi register containing the new string is used as an argument for a call to CreateProcessA. Remember you saw this function in the executable header imports.
Other interesting API function patterns:
- Opening a file from the resource section
- FindResource
- SizeofResource
- LoadResource
- LockResource
- Creating a file
- GetEnvironmentVariable
- CreateFile
- WriteFile
- CloseHandle
- Sleep
- Starting a new process
- CreateProcess
Now you know how to navigate the disassembly forward and backwards to get to interesting routines using control flow instruction (branch, jumps, calls).
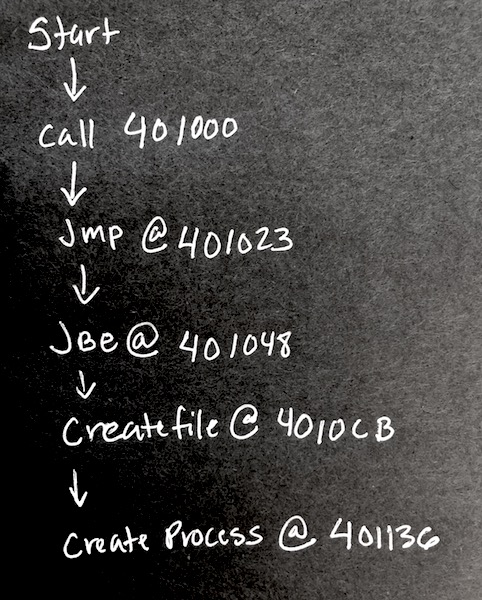
The next step is making a rough path to follow for deeper analysis in the next section.
Collect stage2.exe
Collect C:\Users\victim\AppData\Roaming\stage2.exe and open it in IDA to analyze.
Look for interesting strings
In IDA, go to the strings tab and look for interesting strings. You should see l00k_wh4t_y0u_m4d3_m3_d0 referenced. Similar to the first executable, follow that string to the code location it's being referenced at 00401065
Can you guess what this function is doing?
Trace the function back to start and record the path
Recognizing Buffers
The string l00k_wh4t_y0u_m4d3_m3_d0 was used in function sub_401000 where it was doing the HTTP request. However a buffer was an argument to this function. Unlike the instruction push, lea <reg>, <some address> is another way to add arguments. The register edi stores the address of the buffer.
The excerpt below shows this buffer being given to sub_401000. That same buffer is being compared against 6Ch
.text:00401169                 lea     edi, [ebp-104h]
.text:0040116F                 mov     byte ptr [ebp-104h], 0
.text:00401176                 call    sub_401000
.text:0040117B                 cmp     byte ptr [ebp-104h], 6Ch
HTTP request result
So you know that edi contains the address of the buffer. That buffer is given to InternetReadFile so when the response data from definitely-not-evil.com/l00k_wh4t_y0u_m4d3_m3_d0 will be placed into the buffer
.text:00401104                 push    eax             ; lpdwNumberOfBytesRead
.text:00401105                 push    0FEh            ; dwNumberOfBytesToRead
.text:0040110A                 push    edi             ; lpBuffer
.text:0040110B                 push    esi             ; hFile
.text:0040110C                 mov     [ebp+dwNumberOfBytesRead], 0
.text:00401116                 call    ebx ; InternetReadFile
Buffer Check
The resulting buffer will contain bytes that will be compared against 6Ch, 6Dh, 61h, 6Fh
.text:00401176                 call    sub_401000
.text:0040117B                 cmp     byte ptr [ebp-104h], 6Ch
.text:00401182                 jnz     loc_4012E6
.text:00401188                 cmp     byte ptr [ebp-103h], 6Dh
.text:0040118F                 jnz     loc_4012E6
.text:00401195                 cmp     byte ptr [ebp-102h], 61h
.text:0040119C                 jnz     loc_4012E6
.text:004011A2                 cmp     byte ptr [ebp-101h], 6Fh
.text:004011A9                 jnz     loc_4012E6
.text:004011AF                 mov     edi, ds:LoadIconA
Here is the pseudo code of the assembly
if (buffer[0] != 6C) goto Exit
if (buffer[1] != 6D) goto Exit
if (buffer[2] != 61) goto Exit
if (buffer[3] != 6F) goto Exit
If you follow the address of the branching jump instruction, it will take you to the exit of the program. But this is not what you want. You will need to bypass these branch statements in order to see what happens after it received the HTTP response.
This is the part of the program that we will need to control from a debugger in the next section.
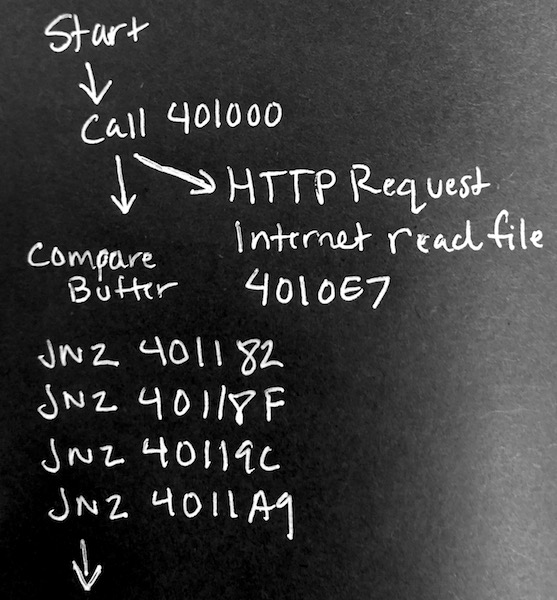
Dynamic analysis is a deeper analysis of the program to understand hidden functionality not understood statically. The static analysis will serve as a guide for stepping through the program in a debugger.
Open the stage2.exe into the x32dbg.exe (referred as x64dbg) debugger and IDAfree.
Remember use the F2(breakpoint), F7(Step Into), F8(Step Over), F9(Run) keys to navigate through the debugger. If you accidentally run past the end the of the program you can always restart by clicking .

Getting to EntryPoint
In x32dbg.exe, run to the entry point by pressing the right arrow in the top menu or Debug->Run.
The debugger should land you at the start function 00401150
Setting Breakpoints
You can set breakpoint by clicking on the dot next to the address in the disassembly view or enter bp <your address in hex> in the command window.
- Set a break point on the jne instruction after
sub_00401000at00401182. Hit run.
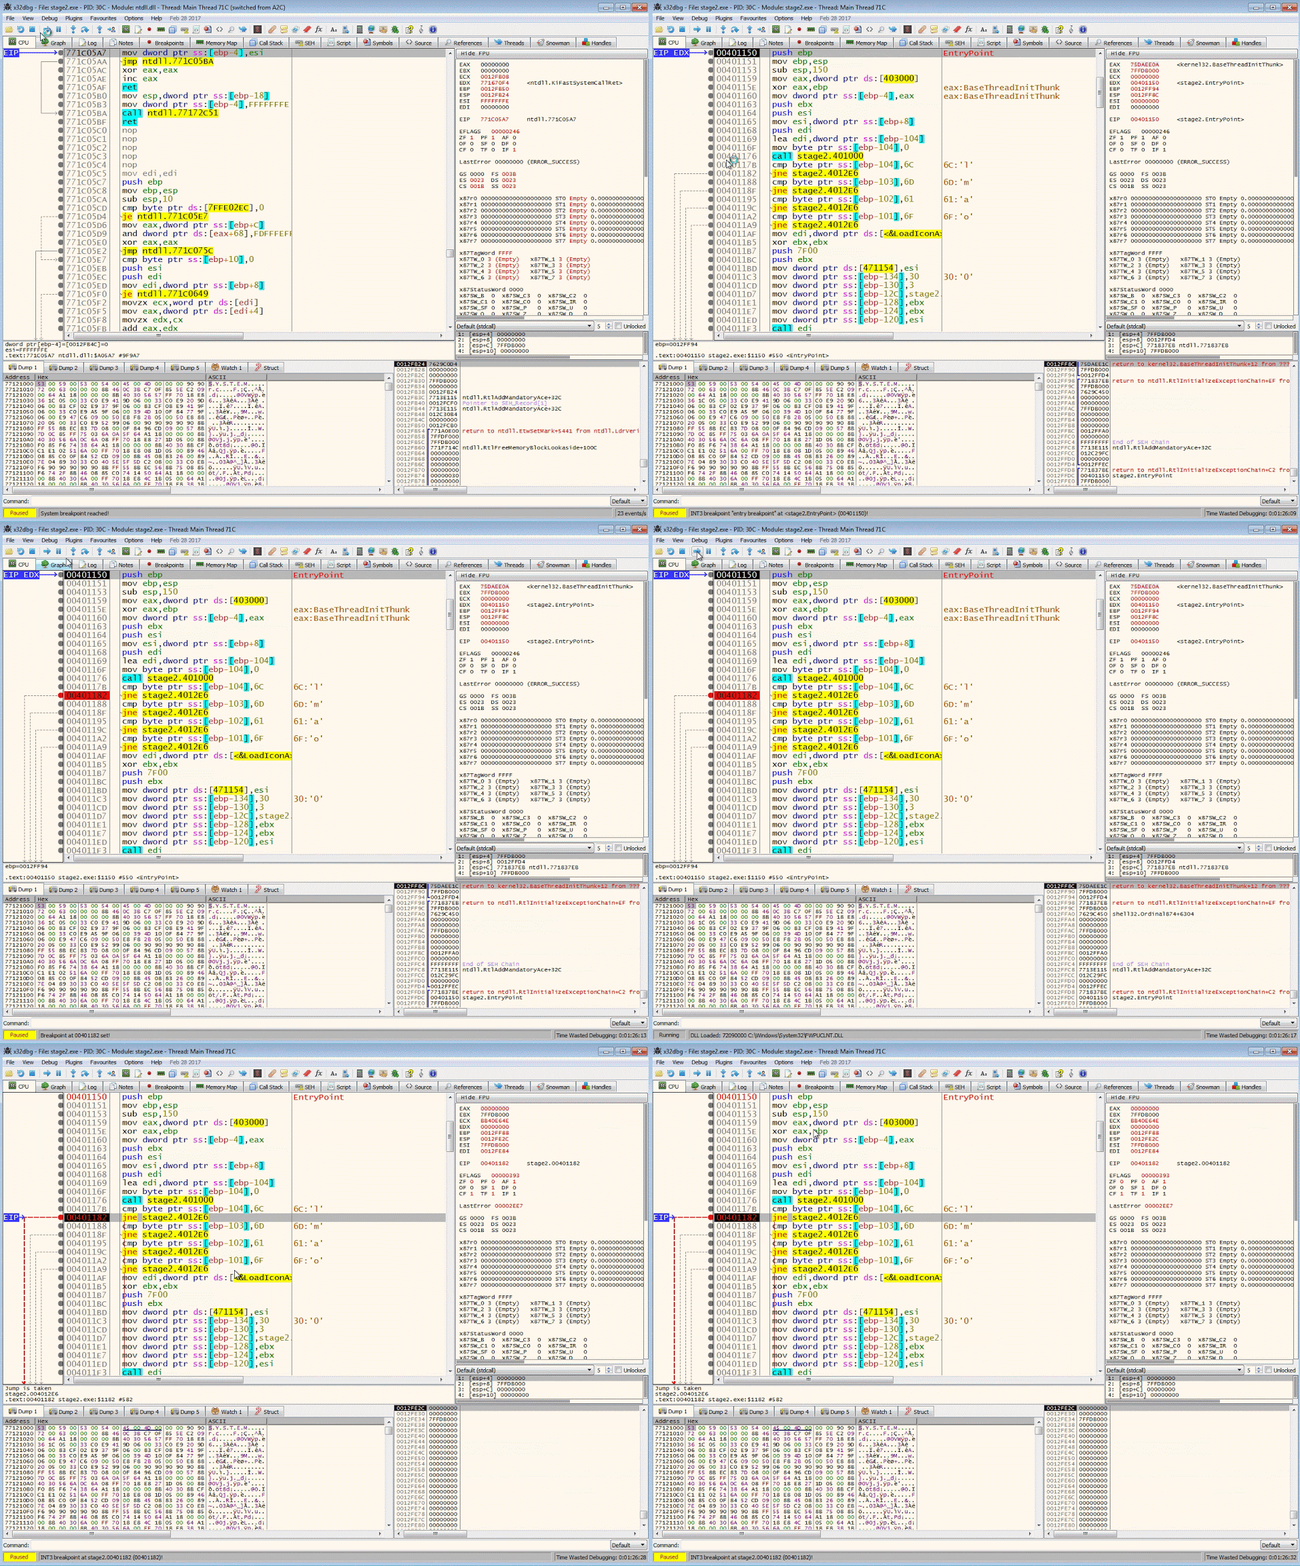
Manipulating the Control Flow
We want to manipulate the control flow instructions so that we can get to the code after the buffer check. Continue to step to the jne (jump if not equal) instruction. By double clicking the ZF flag we can manipulate the result 1 to 0.
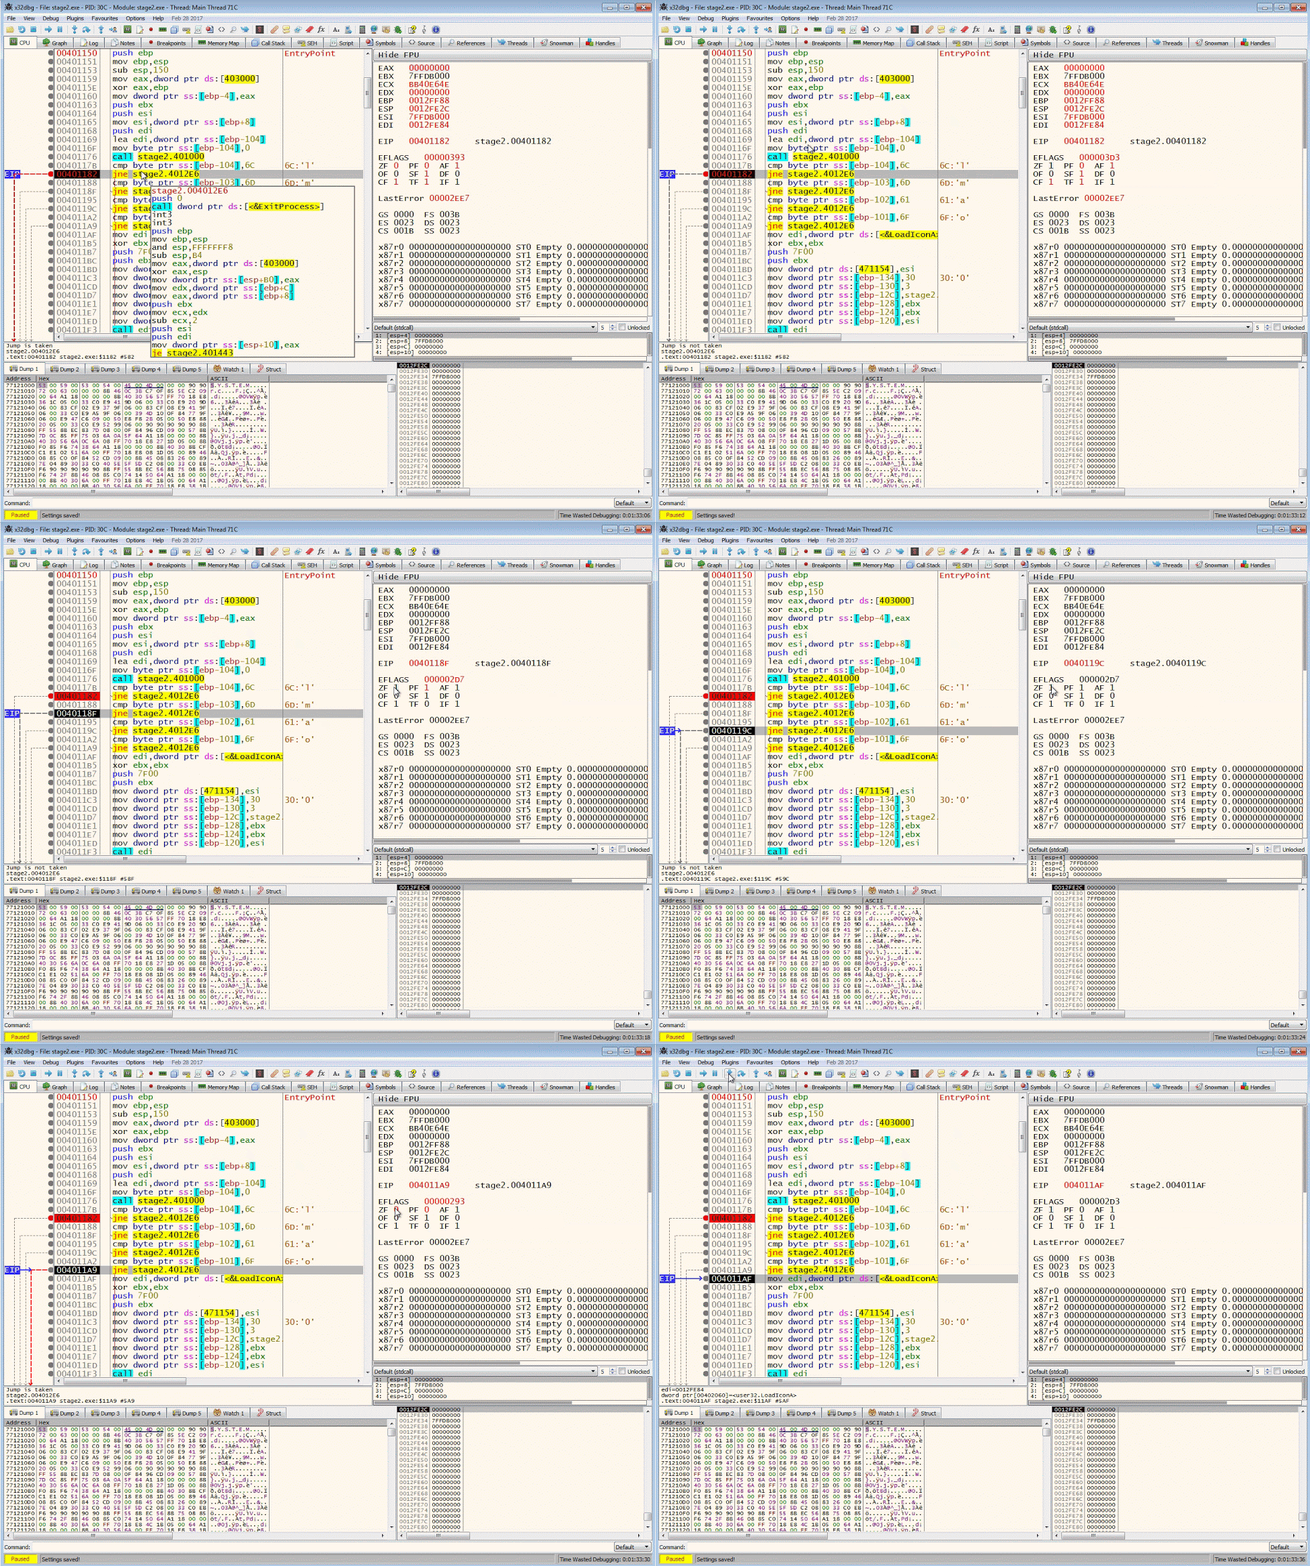
By knowing what the executable is expecting, you will be able to create a fake server that send the information it's looking for. Many RATs (Remote Access Trojans) and bots rely on specific responses in order to perform their duties. By reversing them, you can recreate the response data.
Run the program
Once you have bypassed those 4 branch jump instructions, go ahead and run the rest of the program to collect the last Flag.
Summarize the functionality
As a malware analyst, it's your job to summarize the functionality and relationships of the binaries.
Here is a brief summary of what is happening.
- Unknown.exe will load the first flag in the stack
- It will then extract a file from resources and create stage2.exe in
%APPDATA%folder - It will run stage2.exe as a new process
- stage2.exe will call out to
definitely-not-evil.com/l00k_wh4t_y0u_m4d3_m3_d0and wait to see lmao as the response - It will then create a new message box that contains an image with the second flag
