This workshop provides builds on the fundamentals from re101 for reversing engineering (RE) Windows malware using a hands-on experience with RE tools and techniques. The purpose of this workshop is to get you familiar with Anti Reverse Engineering, Encryption, VM Evasion and Packing techniques.The course will conclude by participants performing hands-on malware analysis that consists of Triage, Static, and Dynamic analysis.
What you'll do
Reverse engineer a real x86 windows malware binary.
What you'll learn
- Understand how Delphi application binaries are structured
- Learn some evasion techniques (Anti-Re, Anti-Automation, Anti-VM)
- Learn how to identify an encryption algorithm
- Execute an assembly program using the Unicorn Engine
- Identify a custom packing technique
- Narrow down specific information and indicators before moving on to deeper static and dynamic analysis.
- How to jump into code in static disassembly then rename and comment on interesting assembly routines that you will debug.
- Deeper analysis of the program to understand hidden functionality not understood statically.
What you'll need
- At least 8 GB of RAM
- At least 20 GB of storage
- Internet connection
- Virtual Machines from RE101
Analysis Flow for Malware Analysis
- Setup a baseline analysis environment
- Triage to determine a starting point
- Static Analysis - Get a sense of where everything is before debugging
- Dynamic Analysis - Determine behaviors that can't be understood by static analysis
- Manual Debugging - Stepping through the program to navigate to your goals
If you haven't already, please take the RE101 workshop. The environment setup is the same.
Download the Unknown Malware
Sha1 for 7z file
bf0104e33909197ed7b98410c93e81430e67950cSha256 Malware inside
8be8abab0f3ebcc18e7b8b3c437feb073fa7b9b30e8b1eef81451f0938b2a52a- Run the Victim VM and copy over the malware.zip into the VM.
- Unzip Warning - DO NOT UNZIP THIS OUTSIDE OF THE VM
You want to find as much information as you can before you begin the static and dynamic analysis.
As mentioned in RE101, please collect the information in this checklist. You can do this list in any order.
- File Context and Delivery
- File Information & Header Analysis
- Get Basic PE information
- Collect Strings
- Simple Web Search
- Check AV vendors
- Quick VM Detonation
- Capture network information
The next page will reveal the information you need.
I personally just start by looking up the hash on VirusTotal because most of the triage information is already there. If it's not on VirusTotal, there are tools in the VMs. You can get the same information by using CFF explorer.
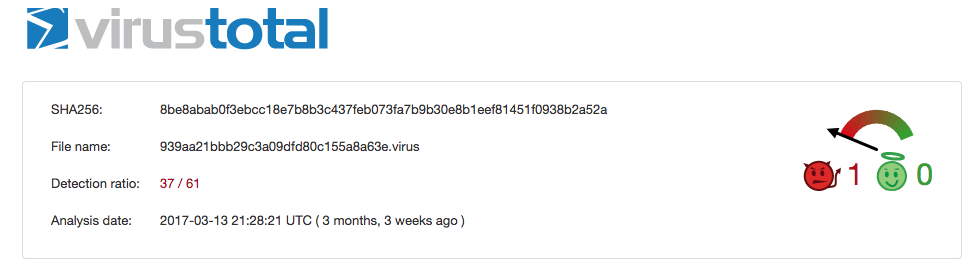
File Context and Delivery
We don't have a victim to tell us how this file was delivered. However you can guess the intent by looking at the original filename in the properties InternalName and FileDescription. As you can see it is posing as the Anti-Virus Malwarebytes software. One can only guess that the malware was pretending to be an Anti-Virus so that the victim will trust it. An IT admin might even overlook the process with the name mbam.exe because it will look legit at first glance.
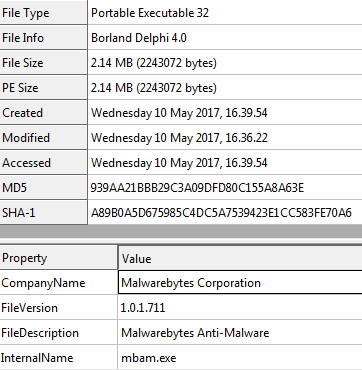
File Information & Header Analysis
We already know that this sample is posing as Anti-Virus Software. How do we know it's not legit? Because we know that this sample is not signed at all or signed by MalwareBytes the company. So that is already a major Red Flag.
Notice that the file size is pretty small, 2.1 MB. Legitimate executables are usually much larger because they have many libraries to ensure that the program has enough resources and support for different execution environments. This file is actually larger than normal malware because of the resource sections, which I will get into later.
Basic PE information
As I explained above, the file size is small but still larger than most malware. That's because 2 reasons:
- It has many resources
- It was compiled as Borland Delphi (
BobSoft Mini Delphi -> BoB / BobSoft).
Why does it matter how the sample was compiled? Because it will determine how the disassembly will be structured.
There are all different types of programming languages, and each with their supporting libraries. The more high-level language such as C#, Python, Delphi the more libraries they need to support transposing the language in to assembly code. This info will become more important when you look at its disassembly.
Imports
Dynamic Linked Library (DLL) Imports are great way to guess what a malware is going to do. Looking at the imported functions for User32.dll you can see there are many API functions related to User Interaction (i.e. GetForegroundWindow, GetCursorPos, etc.). While in Kernel32.dll, there are many functions for memory manipulation (i.e VirtualAlloc, VirtualFree), resource manipulation (i.e. FindResourceA, SizeofResource), and possible Anti-Analysis tricks (i.e.Sleep, GetTickCount). With the imports from Advapi32.dll, we can tell it is going to access registry keys (i.e. RegOpenKeyExA). The more malware you examine, the more you will get use to seeing how they API functions are being used.
Strings Review
Strings always provide a good starting point for clues. It may also reveal things that the PE info was not able to provide such as extra loaded DLLs and API functions. Another hint is looking at junk strings. Junk strings potentially means it is either an image or extra binary data being reference by the sample. It could potentially be an encoded/encrypted/compressed payload. (muhahaha)
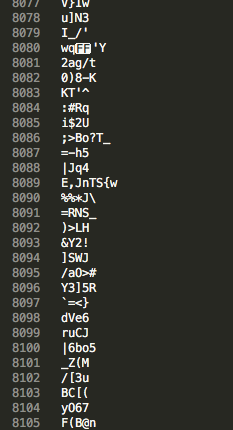
Web search
A string web search is a last resort. I usually use this step to find reports already generated for this family of malware. Unfortunately there is a ton of junk data, so we can assume this sample might be packed/encrypted somehow for now.
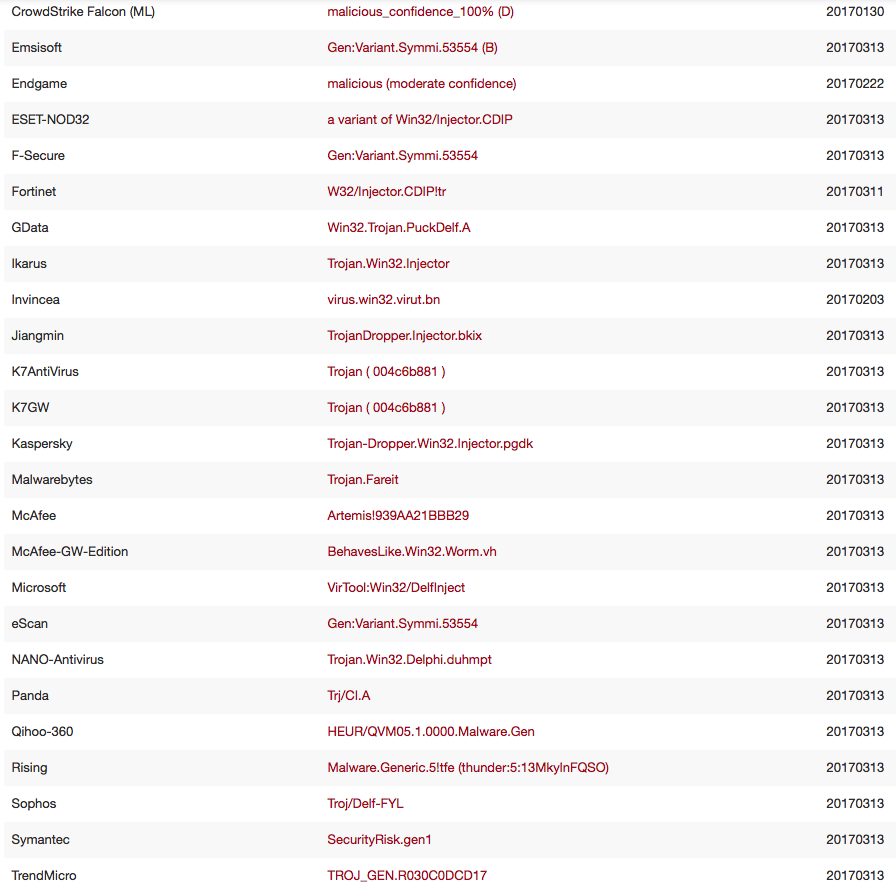
Anti-Virus Vendors
AV Vendors provide some insight into a sample besides just good or bad. There are also many heuristic and generic detections that might not be useful in telling you what the sample is going to do. Keywords like Trojan or GEN for Generic are not enough to tell you how bad it is. However the keyword Injector gives us a hint that it is doing some kind of code in memory manipulation. As we know from above, this malware has a bunch of junk code, so AV might not have enough binary features to make a definitive signature but still does well in telling you that it looks generally abnormal.
VM Detonation & Network Information
If you followed RE101 Lab 1 you will know how to do a simple VM detonation to collect the filesystem, process, registry and network information. You will notice that this sample does nothing really special in the VM. So we will need to investigate why.
Now it's time for static analysis by looking at the disassembly. The point of this section is to create a map of the execution flow of the malware. The easiest way to accomplish this is by starting somewhere in the middle and then working your way backwards. Working backwards helps you create a more accurate route because you can see the forks that led to your current position. You can anticipate the right or left path, in assembly, it's jump or not-to-jump.
Starting somewhere in the middle means picking an interesting function to look at or where a string is referenced. Many malware reverse engineers want to start at interesting API functions like the imports mentioned in the previous section.
Understanding Post-Compiled Structure
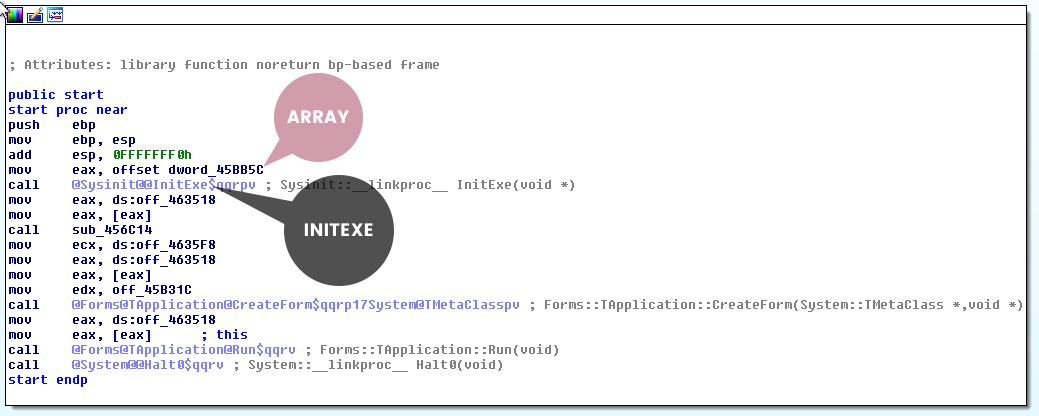
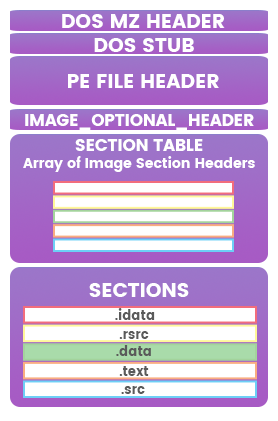
Remember that this sample is Borland Delphi code. This means we will see many functions building up the Delphi libraries. These libraries are organized like object-oriented classes. Each class has an initialization function as well as references to class functions. A Delphi app will sequentially load these structures where libraries are loaded before the main function coded by the malware author. Makes sense, right? In order to use the library, you have to load them first.
The diagram above is a high-level view of how a Delphi app executes each library class. There is a pointer to a hardcoded array/list of these classes which is passed to InitExe function and then the StartExe function. It will loop through this list initializing, executing, and storing pointers to functions for later use. I have identified Main Functions as the possible interesting functions we want to look at. The disassembly equivalent of the diagram is below.
Where to Start?
So we have some options to start working backwards:
- Where was that junk data was referenced.
- Choose an import function (i.e
VirtualAlloc). - Choose a function that is not loading a library.
So the goal here is making the route between the StartExe and choices 1,2, or 3. So let's pick option 1 and start Lab 1 on the next page.
Go ahead and open IDAfree and load the malware. Give IDA some time to parse all of the functions. It should begin the analysis in the start function. If you are not in the start function, select the start function from the function tab/window.
Identifying Delphi
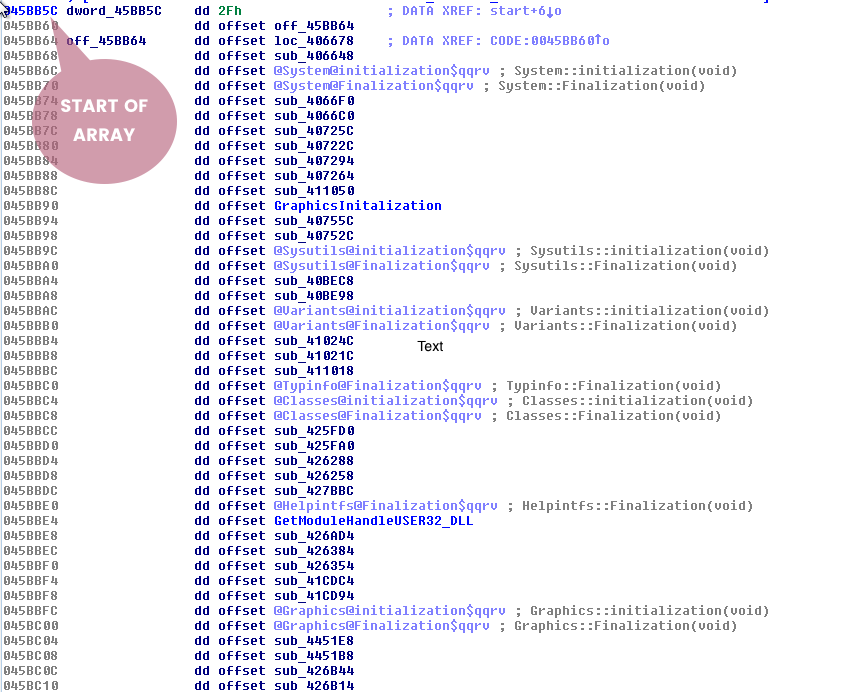
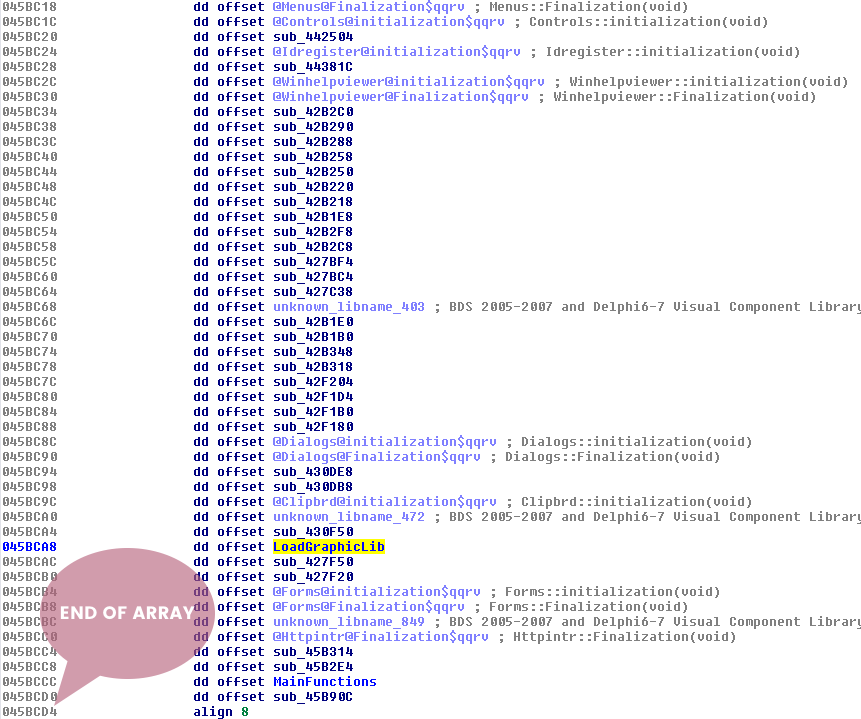
The previous page talked about the delphi structure. You should be able to identify the InitExe and the array of classes at offset dword at 0045BB5C. Double-click on offset dword_45BB5C. Notice that this looks like the array discussed on the previous page.
Junk Data
In the information gathering stage, the strings revealed that there was some junk data being referenced. Let's actually look how those strings are being referenced in the disassembler. Scroll down until you see some junk strings in the DATA section in the IDA Strings panel. Each Portable Executable (PE) section has its own purpose. The DATA (.data) section is typically used for hardcoded global and static variables that are initialized at compile time [1]. This section is more commonly used for storing string references. To see a string referenced in the data section that looks like junk data might be an indicator of foul play.
Follow the Junk Data
Double-Click the first instance of the junk data. At this point is should show you the location in the IDA View. Scroll up until you see a unk reference to the start of this data. It should say unk_45CCD4. You want to follow this reference in the code by selecting and then press ‘x' to open the xrefs menu. This menu shows all the functions and locations that reference the object. Select the only function present and press ok.
IDA should have landed you in the function that is using this data. Notice anything fishy about this function?

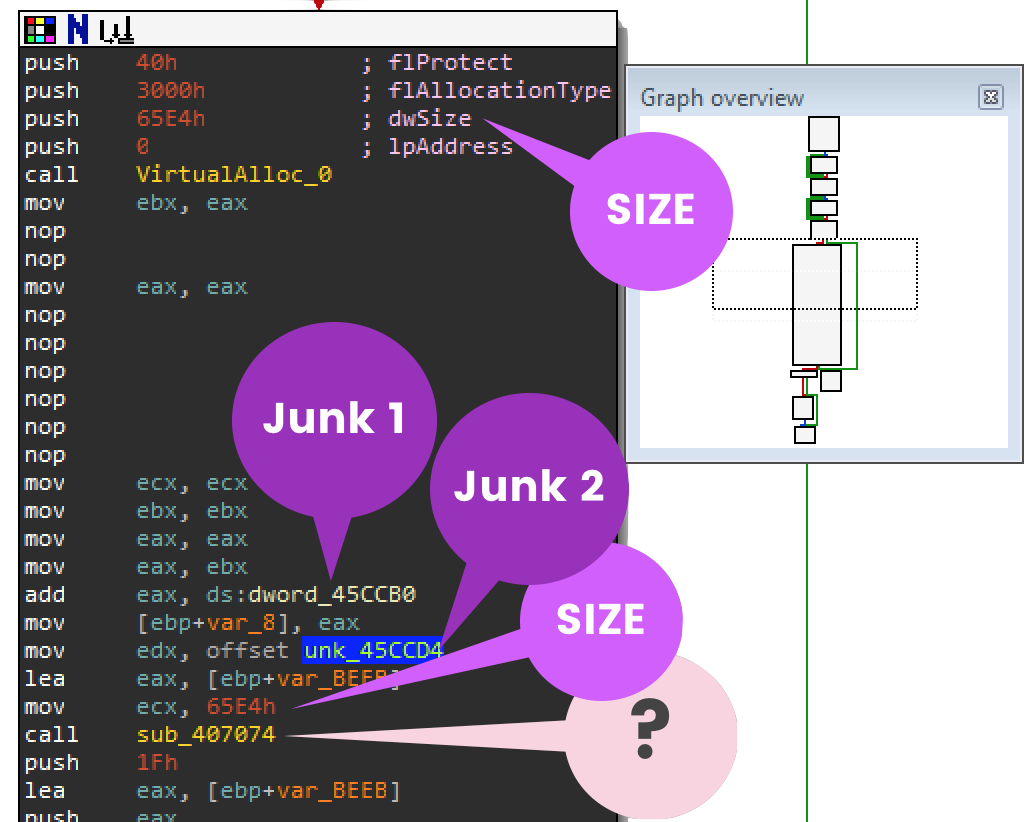
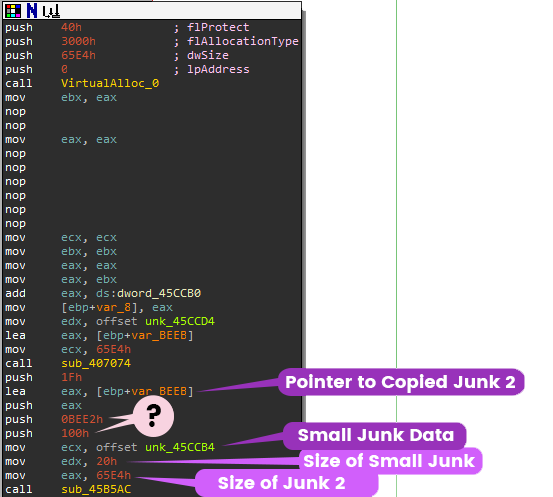
It's calling VirtualAlloc.
So you see that VirtualAlloc with size 0x65E4 hex which is 26,084 bytes decimal. The junk data pointer (labeled Junk 2) is about to be used by function sub_407074. Normally when you see a function following VirtualAlloc, it will copy data into the newly created memory location. You should record the contents of Junk 1 because you will need this dword value later. Finally rename function sub_407074 to something like "copy_to_new_mem".
Trace Backwards
So now you want to find the route between the start function and our renamed function copy_to_new_mem. By using xrefs (selecting & pressing x) you can follow all the functions that referenced the function you selected. Scroll up to the top of the functions and see if you can work your way back to the delphi class library array.
Your notes should be something like this:
Copy_to_new_mem <- sub_45B794 <- sub_45B894 <- sub_45B93C <- 045BB5C (Array)
Renaming each to something notable like:
Copy_to_new_mem <- use_junkdata <- before_use_junkdata <- main_function <- 045BB5C (Array)
Keeping track of this route by the function offset (e.g. 0045B93C) allows you to set breakpoints when you start debugging. You know ahead of time where you want to navigate to.
Recording Control Flow
IDA does a lovely job of showing you green and red arrows for control flow instructions in the assembly. You will want to keep track of instructions like cmp, jmp, jnz, jz, jl, jnb, etc. that affect the route. Recording these locations will come in handy when you start debugging and need to manipulate EFlags to change the decision of the jump.
Record Anything Interesting
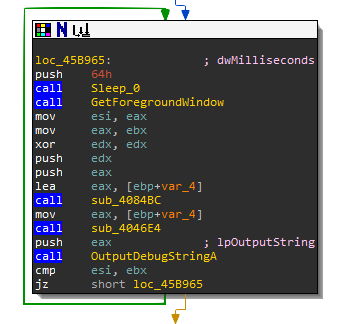
As you are building your route, any API call or string is helpful in identifying the purpose of a function. You may change the name of the function depending on what new information you find. For instance, sub_45B93C (a.k.a. main_function) is doing an interesting routine. Can you guess why this function is using GetForegroundWindow, Sleep, then GetForegroundWindow? If not, record and save it for later. These routines may affect the control flow instructions. The example below shows how the success or failure of OutputDebugStringA is compared using cmp esi,ebx while jz will jump if the result of the comparison is equal to zero. During debugging you may want to manipulate the EFlags so that it will not jump.
Work on Your Own
Take this time to make some nice travel directions. The next page will have what your directions should look like.
- Start
sub_406604- Step into InitExesub_403FA0- Step into StartExesub_403F40- Step into This loops through the static list of functions in the references until the main functionsub_45B93Csub_45B93C- Checks to see if the foreground window has changed
- First it will get the foreground window, then sleep for 64h then capture the foreground window again
0045B991- jz should not jump
- It then tries to check for debug output using string "w4ZUHcHjWZiye735mOUvnkKZ6XwjXIlyrS"
0045B9C1- jl should jump0045B9CB- jnz should not jump
- Tries to unsuccessfully load dll AXLzZmdD9HtbQccvaUl8.dll
0045B9D9- jnz should not jump0045B9DE- jnz should not jump
- Tries to find Atom RkLNPKJEBsQUb
sub_45B894- Step into before_use_junkdata
GetConsoleCP- Retrieves the input code page used by the console associated with the calling process. A console uses its input code page to translate keyboard input into the corresponding character value.0045B89F- jz should not jump- Loops for
0x355aef09times for no reason. Kill the loop by0045B8ADjnz to not jump. 0045B8C4- jnz should not jump- Loops for
0x5A73350times for no reason. Kill the loop by setting jnz to not jump.
sub_45B794- Step into use_junkdata
- VirtualAlloc new memory with the size of 0x65E4
- Nop instructions indicate foul play
dword_45CCB0value is0x42B7unk_45CCD4is the Junk datasub_407074- Step over Copy_to_new_mem, loads Junk data of size0x65E4into new memory: Delphi move(source, dest);unk_45CCB4- loads 0x20 byte stringsub_45B5AC- do_something_interesting( size of junk data, size of 0x20 byte string, pointer to 0x20 byte string, 0x100,0x0BEE2, pointer to newly copied memory of junk data)
Let's save sub_45B5AC for the next section.
This section will focus on generically recognizing encryption routines. In the previous section, you left off at sub_45B5AC. As you might be able to guess, this malware is using an encryption algorithm here. The giveaways are:
- Suspicious function arguments (e.g., large amounts of bytes used for allocation)
- Multiple loops
- Usage of XOR
- Unusual instructions (e.g., NOP)
Suspicious Function Arguments
To decrypt data that is encrypted the malware needs:
- Key
- Encrypted Data (a.k.a ciphertext)
- Destination for Decrypted Data
Let's take a look at the arguments for sub_45B5AC. In the image below, you can see it's pushing 4 times and saving 3 objects in 3 different registers (ecx, edx, eax).
Delphi calling convention
Remember that this is delphi so the calling convention uses registers eax, ecx, edx as first 3 arguments. The rest of the arguments are pushed on stack in reverse order.
push    3
push    4
mov     ecx, 2
mov     edx, 1
xor     eax, eax
call    function
xor     eax,eax
retn    10
Based on previous sections, it should be already obvious to you what these values mean. You know that the malware recently called VirtualAlloc, and moved junk 2 of size 0x65E4 into the new memory stored it in [ebp+var_BEEB]. If you click on unk_45CCB4, you will see that this data is only 0x20 (32 dec) bytes. So, the pseudo code for this function would be:
eax = size_of_junk2
edx = size_of_small_junk
ecx = small_junk unk_45CCB4
sub_45B5AC( 0x100, 0xBEE2, junk2, 0x1F)
Let's rename it all:
eax = data_size
edx= key_size
ecx = key
decrypt(0x100, 0xBEE2, encrypted_data, 0x1F)
Now all you need to know is what 0x100 and 0xBEE2 represent, and you might not know until you start to break down the decrypt function.
Multiple Loops
Cryptographic algorithms are often grouped into two major categories: symmetric and asymmetric. Most of these algorithms in order to perform some sort of shuffling to the plaintext need to loop over each or blocks of characters. Let's take a look at a structure used in many symmetric block cipher algorithms:
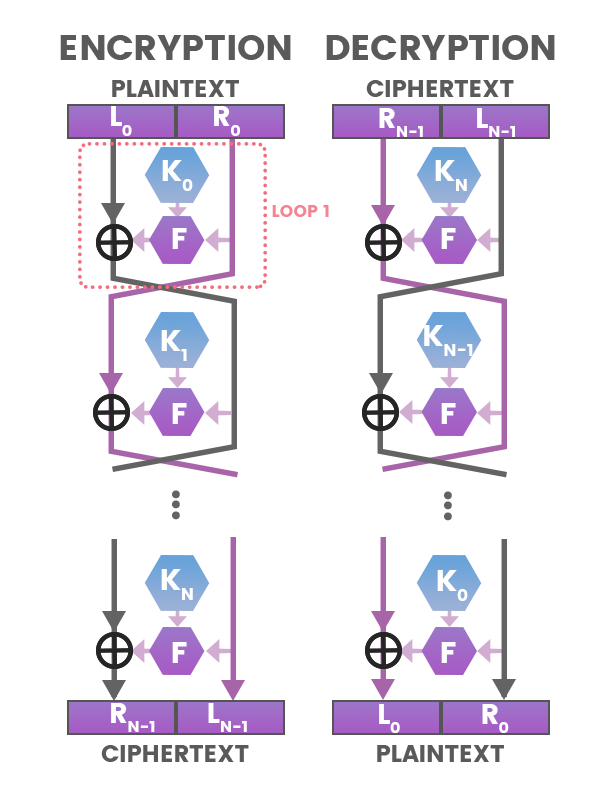
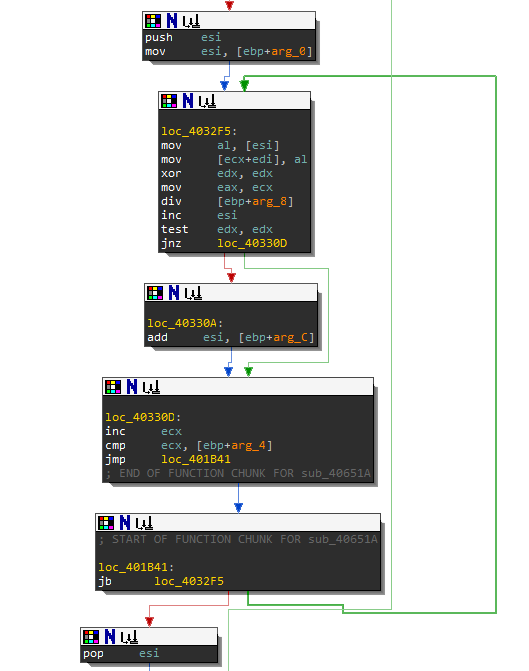
For every subkey K in this algorithm, it has to loop through each K to XOR and Swap. In the disassembly you will be able to see this looping, incrementing, and swapping action going on. Now let's look at sub_45B5AC.
There are actually multiple loops happening in this function. The next section will go over how identifying this algorithm. This section focuses on just recognizing usage of crypto.
Usage of XOR
Bitwise operator, XOR, is the most basic of symmetric key encryption algorithms. Like in the block cipher algorithm above the circle with a cross inside represents the XOR symbol. When reversing assembly code to identify the usage of cryptographic algorithms, you typically want to look for XOR instruction with 2 different registers.
In function sub_45B5AC, xor [esi], al, is another nice indicator of encryption usage.
Suspicious Instructions
In the beginning of this section, it mentioned you need to be suspicious of NOP instructions; however, they are not indicators for usage of cryptographic algorithms. They usually show that the malware author did not want the function to be analyzed or detected. Inserting NOPs changes the patterns of the bytecode of a binary, and makes it harder for AV's signatures to detect those patterns. As an analyst, when I see these NOPs, I can usually tell that I am in the right spot (or a spot that the malware author does not want me to be), so I will start digging deeper.
The next subsection will go over identifying which cryptographic algorithm this malware is using.
Now it's time to dig deeper and follow the assembly one step at a time. From the previous page you recorded what are the arguments and variables used in function sub_45B5AC:
eax = data_size
edx= key_size
ecx = key
sub_45B5AC( 0x100, 0xBEE2, junk2, 0x1F)
Now that you are in the sub_45B5AC function, IDA labels the arguments as:
Arg_0 = 0x100
Arg_4 = 0xBEE2
Arg_8 = junk2
Arg_C = 0x1F
At loc_45B5C9, the registers that saved the key and sizes are moved into base pointer offsets:
45b5cb:    mov [ebp-0xc], ecx ; Key
45b5ce:    mov [ebp-0x8], edx ; Size of Key
45b5d1: mov [ebp-0x4], eax ; Size of ShellcodeNow that you have all the important variables, you can statically trace through this function in IDA to discover it's algorithm.
Loop 1: Saving the Key on the Stack
Arg_C is 0x1F (31 dec) bytes, which is one byte less than the size of our key. Since arrays start from 0, as you can guess this represents key_size-1. This gets saved into register ebx
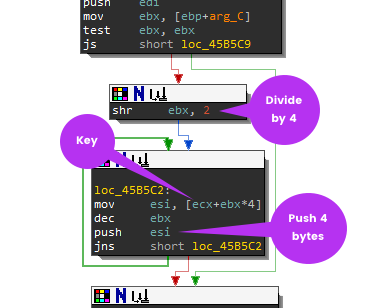
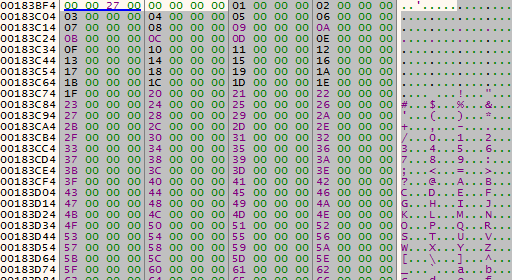
If you are not familiar with mathematical equivalent of bitwise operations, it is important to know shift operations can be a form of multiplication or division. For example, when you see shr ebx, 2, it means that the content of the ebx register is getting divided by 4. This is 31 divided by 4. Why 4? Because when you shift n bits of an unsigned binary number, it has the effect of dividing it by 2^n (rounding towards 0). As it loops through the Key (ecx) is pushes/saves 4 byte chunks onto the stack. It should look something like this:
00183BCC  3669C7AF
00183BD0  CBD60266
00183BD4  0C33A849
00183BD8  973AD4C1
00183BDC  C868B780
00183BE0  820B3D00
00183BE4  2C9BED2C
00183BE8  F94D125D
Loop 2: Fill the Stack 0x100 characters
This next loop fills the stack starting at [ebp+var_418]. It loops for 0x100 times or 256 decimal while incrementing ebx from 0 to 255.
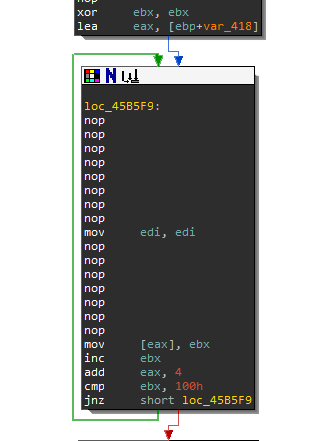
At this stage the question that you need to ask yourself is what crypto algorithm uses 256 bytes with a key size of 32 bytes? You can also even narrow it down to only symmetric key algorithms, since this function is way too simple be an asymmetric key algorithm.
So let's create the pseudo code for this loop:
int ebx = 0;
int length = 256 // 0x100
While (ebx < 256)
{
    push(ebx)
    ebx++
}
This is what the stack should look like:
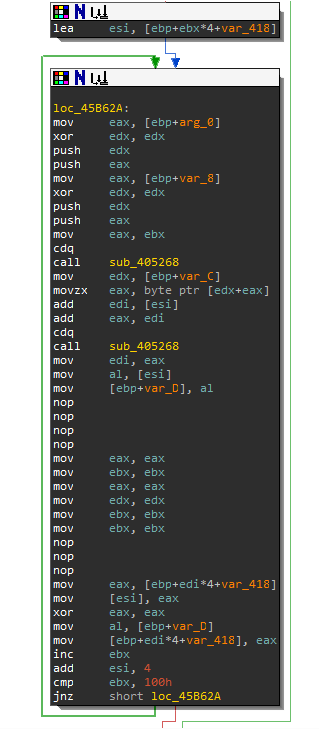
Loop 3: Functions applied to 0x100 characters
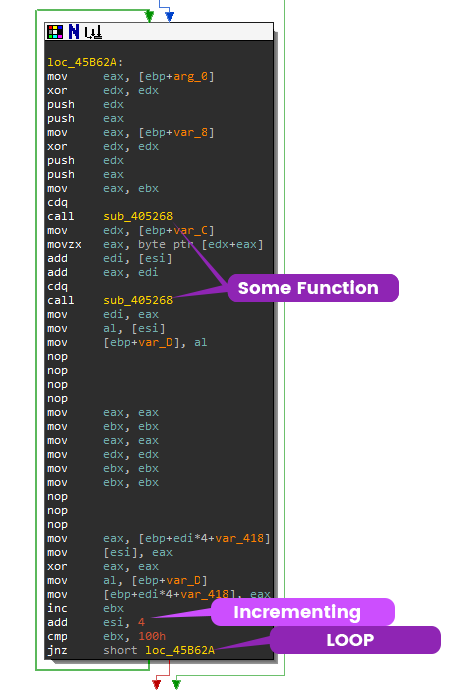
In the same location on the stack [ebp+var_418], the loop processes the data again, but introduces the usage of function sub_405268. This function takes 3 inputs.
The first call to sub_405268:
- 0
- [ebp-0x8] Size of Key which is 32 decimal
- eax
The second call to sub_405268:
- 0
- Arg_0 which is 0x100, 256 decimal
- eax
When you enter function sub_405268, you will notice that there are a bunch of arithmetic instructions. This function is actually a modulo function.
Rename function sub_405268 to "mod".
At the end of the loop, the are some move instructions. Can you guess what is going on here?
ebxis being incremented by 1, let ebx be i where i = 0esiis being incremented by 4, in other words let esi be j where j = 0.[ebp+var_418]is the location of the 0-256 characters created, let it be array[]ebp+var_Cis the pointer to the Keyebp+var_Dis a temporary location on the stack
So let's make the pseudo code for this loop:
int i = 0; //eax
int j = 0;
int temp, a, b, c;
while (i < 0x100)
{
    i = mod( 0, 0x20, i );
    a = Key[ i ]; // eax, [edx+eax]
    b = j+Array[i]; // edi, [esi]
    c = a+b; // add eax, edi
    j = mod (0, 0x100, c);

    //swap
    temp = Array[i];
    Array[i] = Array[j];
    Array[j] = temp;
    i++;
}
Let's see if you can identify this crypto algorithm. Try google searching for "symmetric mod 256". Your first hit might be RC4 from wikipedia.
Check out that Key-scheduling algorithm on the RC4 wikipedia page. Notice any similarities from Loop 2 and Loop 3?
Loop 4: Loop through Junk2 data
Looks like this algorithm is RC4 256. On your own, try to trace through the second part of the RC4 algorithm with the fourth loop. Be extra careful in assigning the variables, because there is an error here and you may not find it right away until you start decrypting.
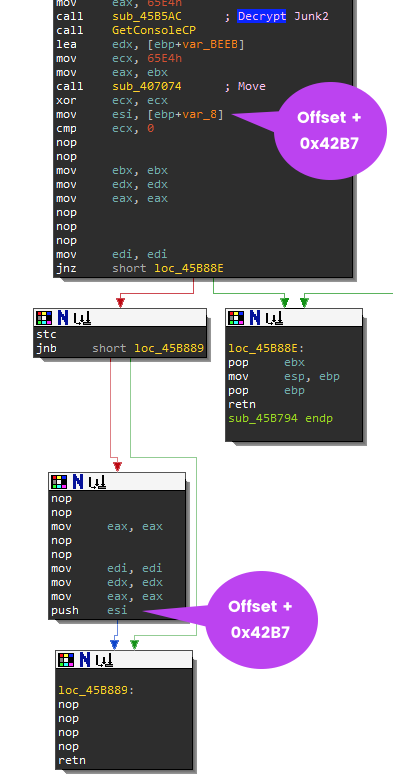
The Return Address
Before we begin to decrypt the Junk2 data, you need to know where our decrypted junk2 will be located at. Let's go back to the subroutine that calls the decryption function in sub_45B794. Remember that DWORD that you saved earlier in the road map? The value 0x4B27 was added to the address of the newly allocated memory (i.e., the return value of VirtualAlloc).. This value Offset+0x4B27 is being saved in register esi and then pushed onto the stack before the function returns. Typically functions will pop the ebp on the stack to restore the previous stack frame of the calling function. Here the eip will return to Offset+42B7 which is where our decrypted junk2 data will be.
You should recognize that the malware plans to execute the encrypted Junk2 data here. Now you know the purpose of the Junk2 data which is Position Independent Code (PIC) more typically known as Shellcode.
Export the Key and Shellcode
In order to extract the shellcode and the key from the malware you will use the HxD hex editor.
In IDA, select the shellcode (labeled as unk_45CCD4) with starting offset of 0x5BED4. From previous sections, we know that the size of this data is 0x65E4. Open the mbam.exe with HxD and choose Edit->Select Block. Plug in the offset and length.
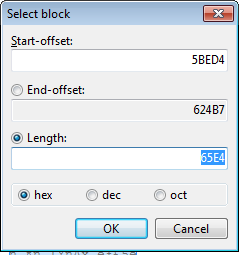
Copy and save these bytes into a new binary file in HxD hex editor and name it shellcode.bin.
Again, in addition to extracting the shellcode, you need to extract the key as well. So, do the same for the key offset and name it as key.bin.
RC4 Decrypt Script
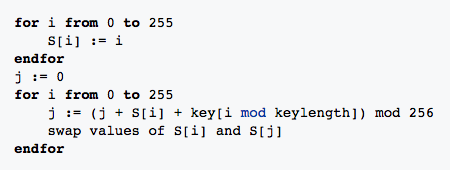
Let's code the RC4 key scheduling and pseudo-random generation algorithm algorithm in Python based on the pseudo code given below:
Key Schedule Pseudo Code 1
for i from 0 to 255
    S[i] := i
endfor
j := 0
for i from 0 to 255
    j := (j + S[i] + key[i mod keylength]) mod 256
    swap values of S[i] and S[j]
endfor
Pseudo-random generation algorithm (PRGA) 2
i := 0
j := 0
while GeneratingOutput:
    i := (i + 1) mod 256
    j := (j + S[i]) mod 256
    swap values of S[i] and S[j]
    K := S[(S[i] + S[j]) mod 256]
    output K
endwhile
Python Code
Here is the python code that mirrors the pseudo code above.
import os
import sys


def key_schedule(key):
    keylength = len(key)
    S = range(256)
    j = 0
    for i in range(256):
        k = ord(key[i % keylength])
        j = (j + S[i] + k) % 256
        S[i], S[j] = S[j], S[i]  # swap
    return S


with open(sys.argv[1], 'rb') as key_file, open(sys.argv[2], 'rb') as encrypted, open("decrypted_shellcode.bin", 'wb') as out:
    key_size = os.path.getsize(sys.argv[1])  # 0x20
    key = key_file.read(key_size)
    S = key_schedule(key)

    j = 0
    i = 0

    shellcode_size = os.path.getsize(sys.argv[2])  # 0x65E4

    while (shellcode_size > 0):
        char = encrypted.read(1)
        i = (i + 1) % 256
        j = (j + S[i]) % 256

        # swap
        S[i], S[j] = S[j], S[i]
        k = S[(S[i] + S[j]) % 256]
        shellcode_size -= 1

        out.write(chr(ord(char) ^ k))
    out.close()
    key_file.close()
    encrypted.close()
Error in the Malware's Decryption Algorithm!

If you run the script above against the extracted data, the decrypted data will not make a lot of sense.This is mainly because there is an error in the RC4 algorithm implemented by the malware author. If you pay attention to disassembled code in IDA, you will see between Loop 3 and Loop 4 the register that stores the j variable was never reseted after the key schedule is made.
Run the Correct Decrypt Algorithm
This python script has the correct decryption algorithm. You can name it "decrypt_shellcode.py"
import os
import sys

def key_schedule(key):
    keylength = len(key)
    S = range(256)
    j = 0
    for i in range(256):
        k = ord(key[i % keylength])
        j = (j + S[i] + k) % 256
        S[i], S[j] = S[j], S[i]  # swap
    return S, j


with open(sys.argv[1], 'rb') as key_file, open(sys.argv[2], 'rb') as encrypted, open("decrypted_shellcode.bin", 'wb') as out:
    key_size = os.path.getsize(sys.argv[1])  # 0x20
    key = key_file.read(key_size)
    S, j = key_schedule(key)

    """
    A normal RC4 stream algorithm
    resets j before a second use.
    """
    # j = 0

    i = 0

    shellcode_size = os.path.getsize(sys.argv[2])  # 0x65E4

    while (shellcode_size > 0):
        char = encrypted.read(1)
        i = (i + 1) % 256
        j = (j + S[i]) % 256

        # swap
        S[i], S[j] = S[j], S[i]
        k = S[(S[i] + S[j]) % 256]
        shellcode_size -= 1

        out.write(chr(ord(char) ^ k))
    out.close()
    key_file.close()
    encrypted.close()
In the Victim VM, open up the command prompt and run the following line. Replace location to the folder you stored the bin files and script.
c:\Python27\python.exe <location>\decrypt_shellcode.py <location>\key.bin <location>\shellcode.binNow that you have the decrypted shellcode let's turn it into an exe so you can analyze it in IDA. The next subsection will provide these instructions.
Now you have the decrypted shellcode. This section will go over converting the shellcode into an executable so that you can view the disassembly in IDA.
Keep in mind that you don't need to do this step, but converting it into an executable will help you in debugging and understanding the deployed VM evasion techniques which are heavily discussed in the next section. You can open the decrypted_shellcode.bin in IDA and notice that the disassembly is not parsing functions properly. The malware author has inserted extraneous assembly instructions to through off malware analysis. 0x78 means assembly instruction js or Jump short if sign (SF=1).
00000000: 7878 7878 7878 7878 7878 7878 7878 7878  xxxxxxxxxxxxxxxx
00000010: 8b45 088b 4034 55e9 6761 0000 786a 6866  .E..@4U.ga..xjhf
00000020: 8995 34ff ffff 5a6a 7266 8995 36ff ffff  ..4...Zjrf..6...
00000030: 5ae9 2506 0000 7878 7878 7878 7878 7878  Z.%...xxxxxxxxxx
00000040: 7878 7878 7878 7858 6a74 6689 45c8 58e9  xxxxxxxXjtf.E.X.
00000050: 0229 0000 7878 7878 7878 7878 7878 7878  .)..xxxxxxxxxxxx
00000060: 7878 7878 7878 7889 5d88 e8af 3b00 0081  xxxxxxx.]...;...
...
There are many tools and scripts available that help you convert shellcode into an exe like shellcode2exe.py. However I have found that Hexacon provided a nice easy tutorial for converting shellcode into an executable. This section will be using this YASM and GoLink to create the executable while using CFF explorer to edit the binary header.
- Download Yasm yasm-1.3.0-win32.exe
- Extract yasm-1.3.0-win32.exe and rename it to yasm.exe
- Download GoLink linker Golink.zip
- Extract golink.exe
- Create a decrypted_shellcode.asm file with the following instructions
Global Start
SECTION 'AyyLmao' write, execute,read
Start:
incbin "decrypted_shellcode.bin" - From a command line run the following command to assemble the code:
yasm.exe -f win32 -o decrypted_shellcode.obj decrypted_shellcode.asm- Now run the linker
golink /ni /entry Start decrypted_shellcode.obj- Open shellcode.exe with CFF explorer and open the NT Headers->Optional Headers->AddressOfEntryPoint. Add the current value to
0x42B7which was the offset of where the malware was going to return to in functionsub_45B794. AddressOfEntryPoint should be000052B7. This will ensure that IDA knows where to start the disassembly.
This section will focus on identifying various evasion techniques as well as working around them during the debugging phase. Now that you will be working with a new executable, you will need to create another road map.
Control Flow Obfuscation
You will notice that the shellcode is broken up into extraneous and unnecessary jumps. This is meant to throw off malware analysts. Malware that has this kind of useless instructions is usually processed with some kind of obfuscation kit (e.g., cryptors). Malware authors rarely write new shellcode and will sell, share, or reuse this code.
Going forward, you should be viewing the disassembly in graph mode, as it makes it easier to understand the control flow. Below is an example of the flow-chart mode of these jumps.
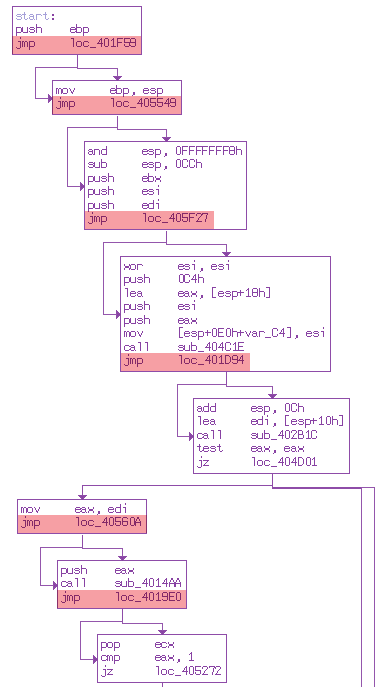
Where to Start?
There are no strings for us to investigate and there are no functions parsed by IDA. So, you need to start exploring each function one by one finding an interesting piece of code to analyze. This comes with experience. If this seems too daunting, then manual debugging is your next option. The goal is to make a road map of shellcode by working backwards.
String Obfuscation
The first function call sub_404C1E doesn't look like something interesting, so move on to the next function call to sub_402B1C. This function is a jump-wrapper for the function sub_4059A3.
Notice anything strange about the immediate values being placed onto the stack? These are actually strings. Breaking up strings and pushing them onto the stack is a common of hiding strings from malware analysts. Go ahead right-click these numbers and convert it to a string (R).
They should look like this afterwards:
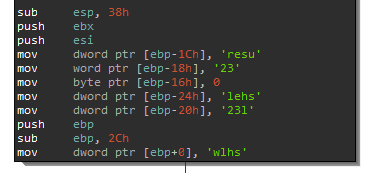
Dynamic Library Loading
With shellcode or position independent code (PIC), the code needs to load resources and libraries to work with before it performs the nefarious routines. Based on the strings above you can tell that it is going to load these libraries:
- user32
- shell32
- shlwapi
- advapi32
Access to the Process Environment Block (PEB)
After the advapi32 string gets loaded onto the stack, enter the function sub_405421.
This function is accessing the FS segment register at offset 30. This register is commonly used by OS kernels to access thread-specific memory. This specific offset (i.e., fs:[0x30]) points to the Process Environment Block. This is a common shellcode tactic to get handles to loaded windows libraries a.k.a. Modules, specifically the base address of kernel32 from the PEB.
mov     eax, 30h
mov     eax, fs:[eax] ; Get the address of PEB
mov     eax, [eax+0Ch] ; Get the address of PEB_LDR_DATA
mov     eax, [eax+0Ch] ; InLoadOrderModuleList
mov     eax, [eax] ; get the next entry
mov     eax, [eax+18h] ; get Kernel32
The second instruction mov eax, [eax+0Ch] gets the address of the PEB Loader Data from the PEB struct. The PEB_LDR_DATA contains the struct for the InMemoryOrderModuleList which is where it gets the pointer for Kernel32.
struct PEB_LDR_DATA {
    DWORD Length;                                       ; 0
    BYTE Initialized;                                   ; 4
    void* SsHandle;                                     ; 8
    struct LIST_ENTRY InLoadOrderModuleList;            ; 0ch
    struct LIST_ENTRY InMemoryOrderModuleList;          ; 14h
    struct LIST_ENTRY InInitializationOrderModuleList;  ; 1ch
};
Save these functions sub_402B1C and sub_405421 for debugging later. Also include these into your road map for the shellcode executable.
Checking the Filename and Path
Go to the next function sub_4014AA which is a wrapper for function sub_401D36. Again, this function is using an anti-analysis technique of pushing a string one by one onto the stack. Can you guess what this function is doing?
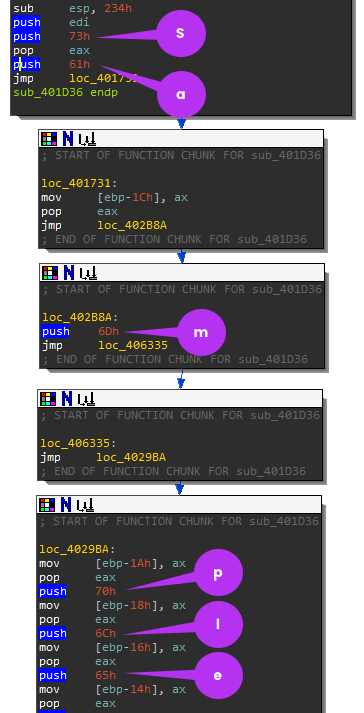
The strings are:
- sample
- sandbox
- virus
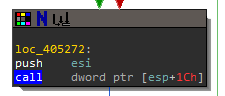
It seems the malware author wanted to detect if this executable contained strings related to malware analysis. You will need to debug this function to see which string it's comparing these values. You will want to avoid this function because you need to get around the anti-analysis detection. Remember that functions return 0 or 1 in eax depending on the success or failure. You want this function to fail or return 1 because you want to get around these traps. Below the instruction cmp eax, 1 and jz loc_405272 is where the comparison to the return value occurs. During debugging, you would want to force the jump by changing the EFlags.
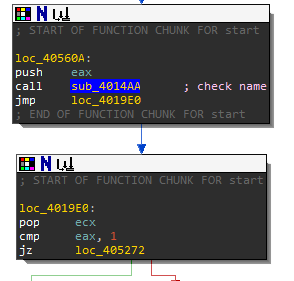
Time to Start Debugging
After jz loc_405272 there is a call to [esp+1Ch] this is actually calling a Windows API call that was loaded there by the loaded library function sub_402B1C. It would be tedious to go through those locations by hand, so let's start debugging.
The next page will go over debugging the decrypted_shellcode.exe with x32dbg.
Debugging should be your last resort, as it can be time consuming. However, for the sake of teaching, I will go over it anyway. Be sure to take a snapshot of your VM before you begin debugging. This snapshot will come in handy when you accidentally run the malware sample.
Create the Breakpoints
Open decrypted_shellcode.exe in x32dbg.
At this point you should have recorded the following functions along with their corresponding locations:
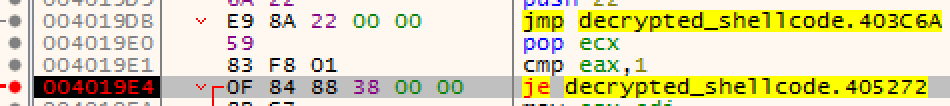
sub_402B1C@00401D9B- The function that loads the librariessub_4014AA@0040560B- The function that checks for sample, sandbox, and virusjz loc_405272@004019E4- The jump to modify the EFlags if necessaryjnz loc_405277@0040526C- The jump to modify the EFlags if necessaryloc_405272@00405272- The location that calls the unknown APIloc_405277@00405277- The location that calls the unknown API
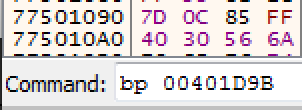
Place a breakpoint with x32dbg using the command line. Example: bp 00401D9B
Now press F9 to run the program to breakpoints until you reach 004019E4.
Scroll down to check out offset 00405272. Looks like the [esp+1C] is using Path Windows APIs to check the strings against sample, sandbox, and virus. Since your exe name is and path does not contain these words, it will not take the jump. Thus, no need to change the flags or patch the instruction. Keep pressing F8 (to step over the instruction) until you reach the offset 00405277.

Congrats! You bypassed the first evasion technique deployed by this malware . Now that you know what these API calls are, you should be renaming the subroutines in your IDA with appropriate labels.
Adding Resources
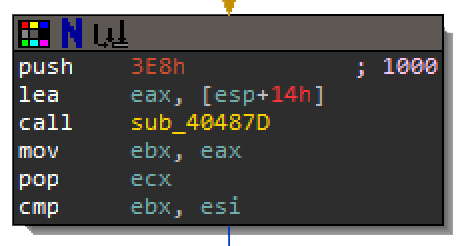
Step F7 the program until you reach the next function sub_40487D. Be sure to record the arguments pushed onto the stack. Step Into F7 function sub_40487D. Next step until you reach 00401632 and look down to 00401645. The calls to GetModuleHandle and FindResource indicate that the malware is about to access a resource.
This is typically how you get a resource from an exe:
HMODULE hModule = GetModuleHandle(NULL); // get the handle to self (exe)
HRSRC hResource = FindResource(hModule, MAKEINTRESOURCE(RESOURCE_ID), RESOURCE_TYPE);
HGLOBAL hMemory = LoadResource(hModule, hResource);
DWORD dwSize = SizeofResource(hModule, hResource);
LPVOID lpAddress = LockResource(hMemory);
When you turned the shellcode into an exe it did not include any resources. Remember that the original exe is where this shellcode gets executed. So, you will need to get the resource from the original exe and import them into shellcode exe. The argument passed to the function sub_40487D was 0xE38 which is 1000 in decimal. If you keep stepping through function sub_40487D you will see the routine above, and notice that the argument to find the resource is 1000.
HRSRC WINAPI FindResource(
  _In_opt_ HMODULE hModule,
  _In_     LPCTSTR lpName, //ID of the resource
  _In_     LPCTSTR lpType
);
Close x32dbg while you edit the decrypted_shellcode.exe.
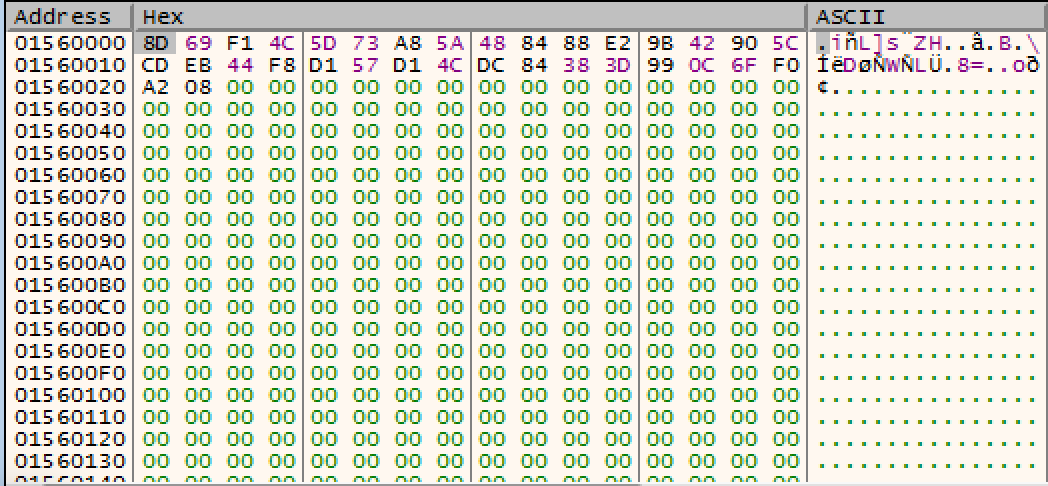
Open up the original exe in CFF explorer and look for the resource 1000. Next export this resource under Resource Editor, right-click and Save Resource (RAW). Take a moment and look at the data of this resource. Hint: looks like more junk data.
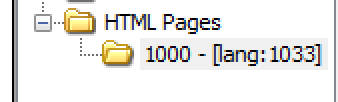
Once you exported the resource 1000, open the decrypted_shellcode.exe with CFF explorer. In the Resource Editor add Add Custom Resource (Raw) with the id of 1000. It should mirror the original exe. Afterwards open decrypted_shellcode.exe with x32dbg again. Navigate back to function sub_40487D or just set a breakpoint at 0040487Dand run until that function.
Saving Junk and Chunks in Memory
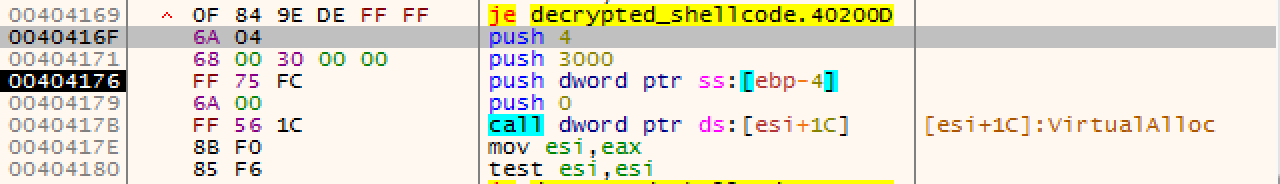
Keep stepping until you reach 0040416F where you will see that the resource is being placed into a new memory allocation. Remember that VirtualAlloc is typically followed by a ‘mov instruction'. After the VirtualAlloc function is returned make sure you note the address of the newly allocated memory. As before, this function will put the address of the allocated memory in the eax register (the returned value).
Once you are done stepping through function sub_40487D step until you reach loc_4014C2.
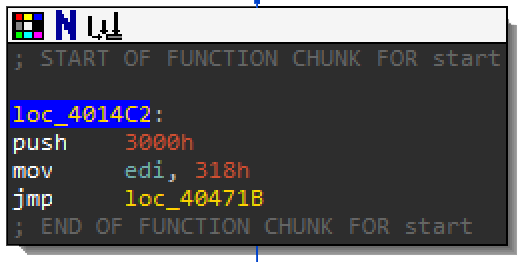
The size 0x318 is a common theme for the next couple of function calls. This is where you will see another combo of VirtualAlloc and mov. It will store the first 0x318 bytes into the newly allocated memory.

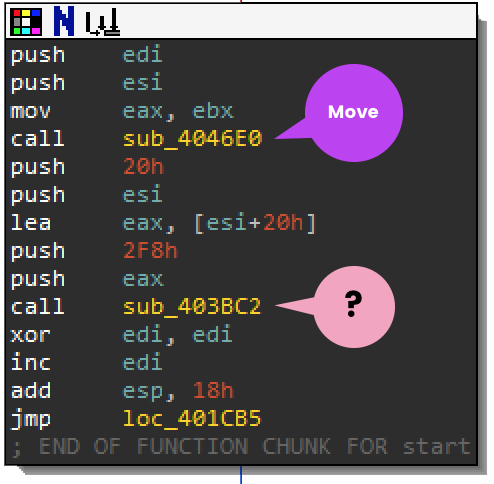
Does function sub_403BC2 look familiar? Here is the breakdown:
Arg_0 CopiedData+offset 20h
Arg_1 0x2F8 size
Arg_2 CopiedData
Arg_3 0x20 size
Why offset 0x20? Here is the dump of the CopiedData:
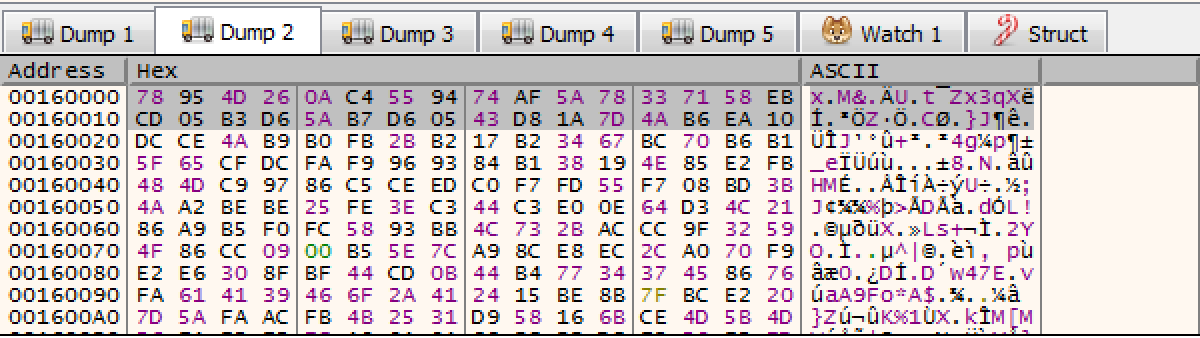
At this point it's too early to guess what this data does.
78 95 4D 26 0A C4 55 94 74 AF 5A 78 33 71 58 EB CD 05 B3 D6 5A B7 D6 05 43 D8 1A 7D 4A B6 EA 10In IDA, glance through function sub_403BC2. There are 3 hints that give away what this function is doing.
- The use of
0x100and0x20 - Multiple loops
- The use of XOR
If you remember from the previous Lab 2, multiple loops and the use XOR is indicative of being some kind of crypto algorithm. There is a theme of crypto here, but there is just a slight difference. The use of anding a value with 800000FFh is also a form of modulo for X mod 256. Earlier we saw that the modified RC4 algorithm was using a delphi mod function instead.
As you might have guessed, it looks like the malware is using RC4 again, but you might want to step through the algorithm to confirm if it's the correct RC4 or the modified RC4 like from Lab 2. Once you have, you will notice that the first 32 bytes (0x20) decrypted the rest of the CopiedData 760 bytes (0x2F8). Be sure to save the address of this memory in your notes, and rename the functions in IDA as you will need to go back to them for later in the workshop.
Step through until you reach loc_401CCA and continue to the next page.
Anti-Automation
Before you continue to loc_401CCA, there were some Anti-Automation behaviors that were not discussed from earlier in the workshop. The calls to GetForegroundWindow, Sleep, and GetForegroundWindow indicate that the malware is deploying various anti-automation techniques to ensure that there is an actual user changing the state of the foreground window. Typically in automated sandbox testing there is no user interaction unless they accounted to build that into their VM.
Anti-Debugging
If you remember from earlier in the workshop, there were many calls to OutputDebugString. Instead of directly calling for IsDebuggerPresent, calling OutputDebugString and checking the success or failure is another technique to check if there is a debugger running. It's a simple tactic to make reverse engineering and debugging the malware harder.
VM Evasion
There are many resources for a developer to identify if the process is running in a Virtual Machine. Paranoid Fish or pafish is one of the more well-known automated VM identification scripts available. You can view the code here: https://github.com/a0rtega/pafish.
Every VM distro has their own filesystem and registry indicators. Products such as VMware and VirtualBox often have software installed to help with host to guest sharing. Hardware simulation will contain strings and naming related to the VM product. Some malware will change their behavior if they find out they are running inside a VM.
In IDA, start back at loc_401CCA where you will be able to identify some VM Evasion techniques.
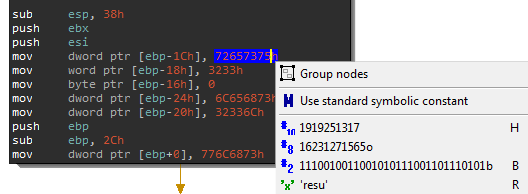
Checking Hardware Device
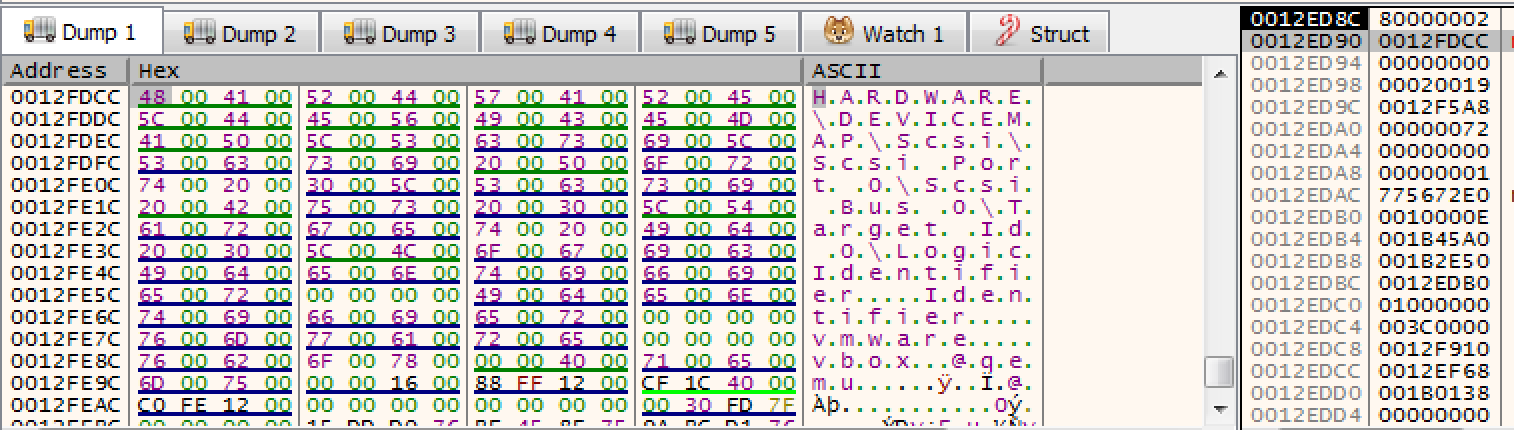
Earlier in this section, there was an anti-analysis technique of pushing strings to the stack. In function sub_4029E7 until you are in function sub_402274, you can see that it is pushing H and A in the screenshot below.
Go ahead and go through all the strings that are being pushed to the stack. It should com out to:
HARDWARE\DEVICEMAP\Scsi\Scsi Port 0\Scsi Bus 0\Target Id 0\ Logical Unit Id 0\Identifier
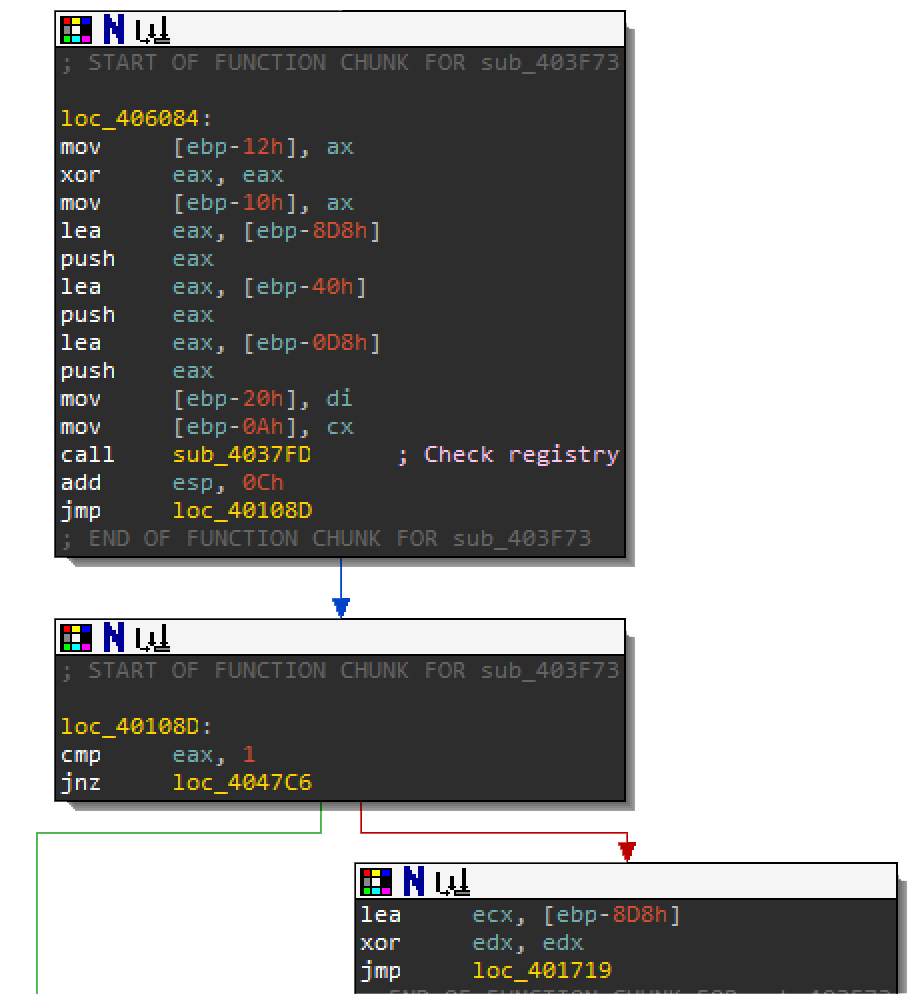
At the very end of the function it jumps to loc_404777 where it calls sub_403F73. This is where the shellcode pushes strings vmware, qemu, and vbox. The malware is checking for registry artifacts to see if it's running inside a VM. In the debugger, set a breakpoint and run/step into 00406AB6 within function sub_4037FD. This is where the call to RegOpenKeyEx happens.
If you follow the stack argument DWORD in the dump you can see the full strings. To view this, right click on the stack argument and select Follow DWORD in dump.
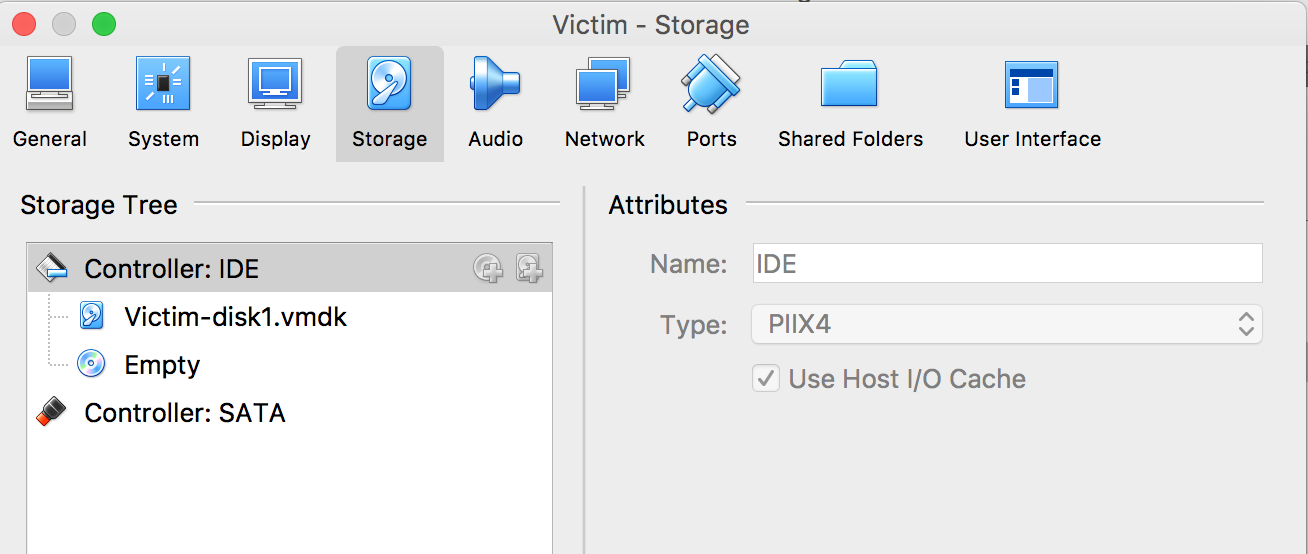
Open regedit.exe in Windows and verify that this registry key exists under HKEY_LOCAL_MACHINE. If this key exists RegOpenKeyEx will return 0, if not 2. In the debugger, Step over F8 this function call. Fortunately this VM was built with an IDE instead of scsi hardware. You can verify this by looking at Virtualbox's storage settings.
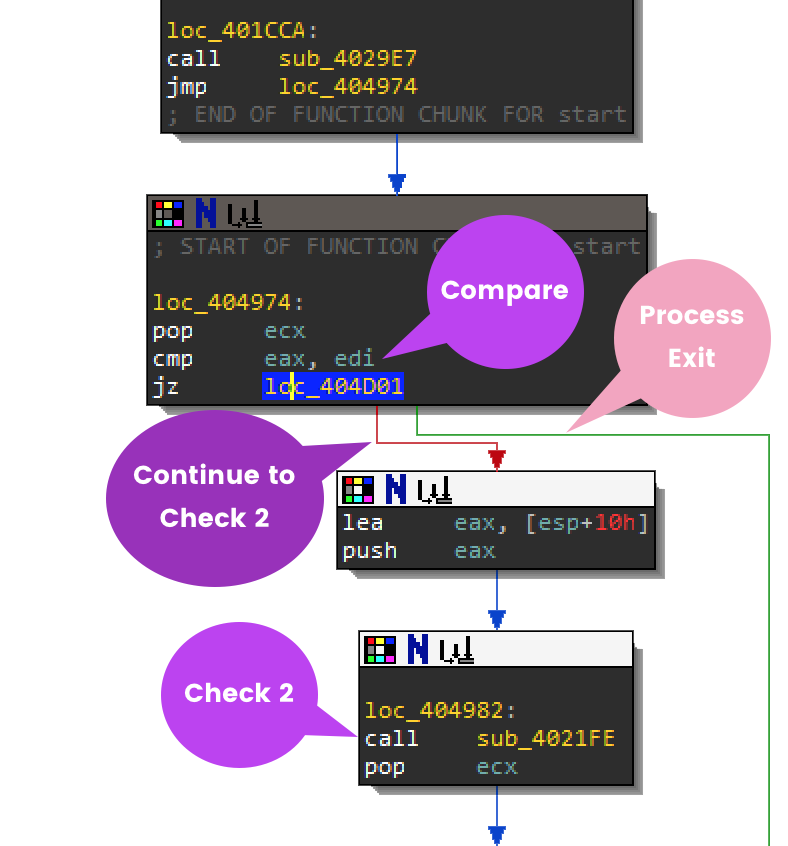
If the VM you are working in does happen to have this registry key, you can always bypass the check. You can either get rid of the artifacts themselves or patch the binary. Put a breakpoint at 00404977 so that you won't miss this next jump. When you are debugging you can modify the ZF flag so that jz loc_404D01 will fail and continue onto the next check.
Check the System Bios
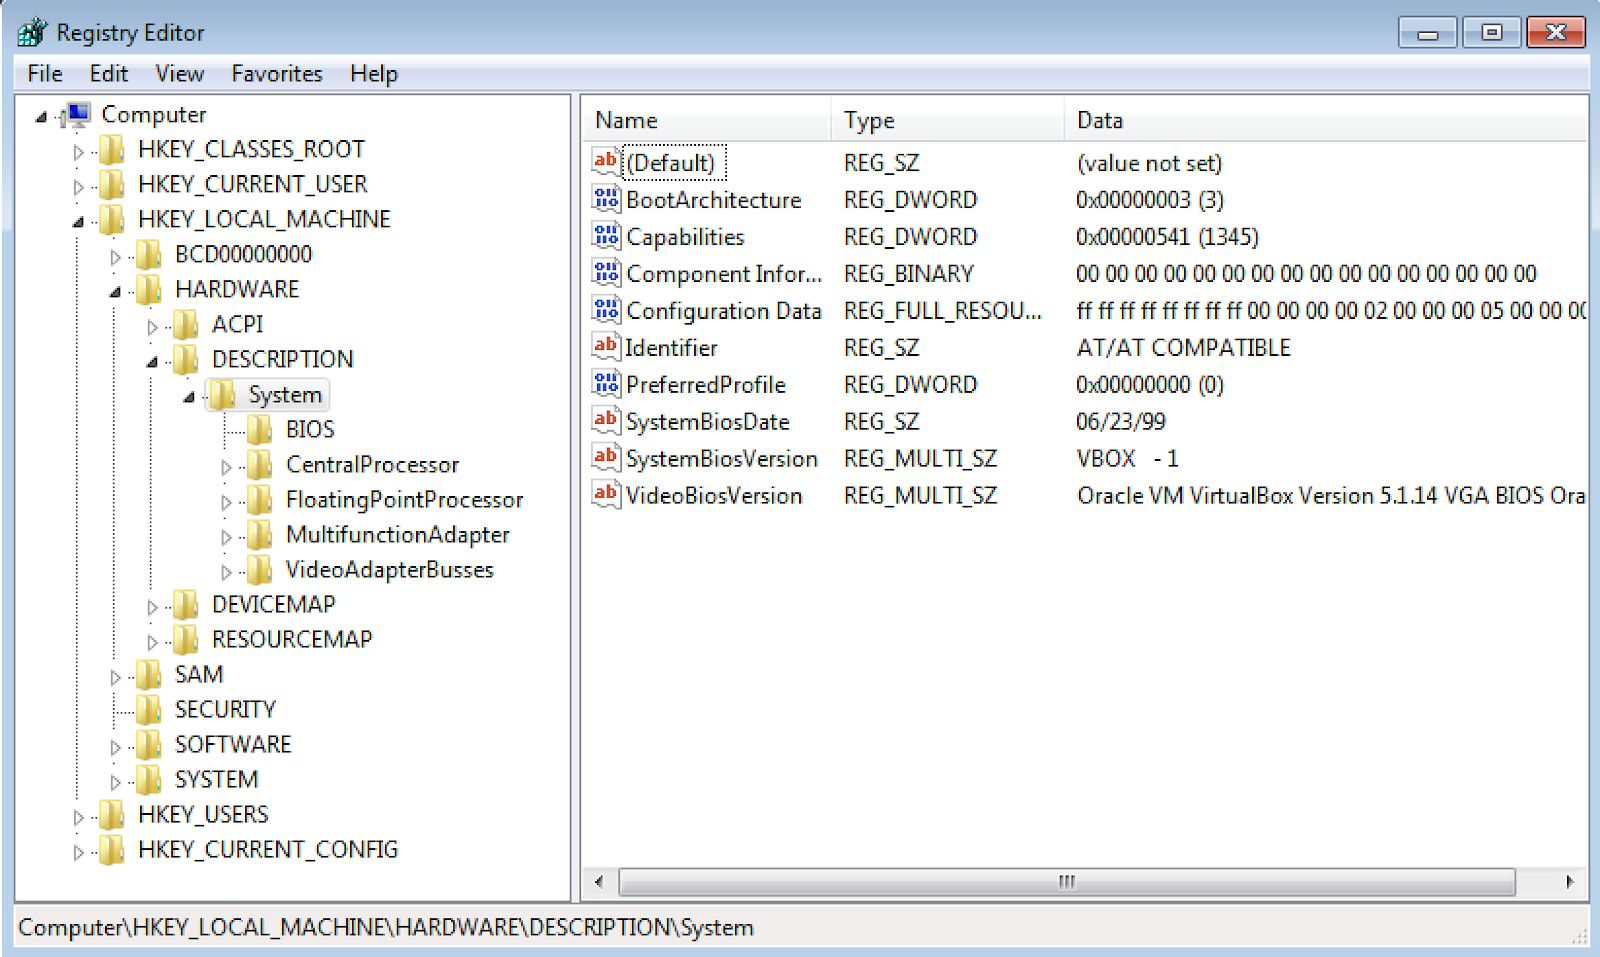
Continue to step F7 to function sub_4021FE at 00404982. This function is using the same anti-analysis technique by pushing strings onto the stack. The strings vbox and qemu are used to check the value in another registry key. Step through the rest of this function to reveal the full string until you reach 004047A7.
The registry key that you should have recovered from the stack is:
HARDWARE\Description\System\SystemBiosVersion\SystemBiosVersionVerify in the registry using regedit.exe that this registry key exists. It looks like vbox does exist in the SystemBiosVersion string. You will need to modify the jumps in order to bypass this check in order to continue.
There are 2 places where you can choose to modify the jump:
- Right after the registry key check function:
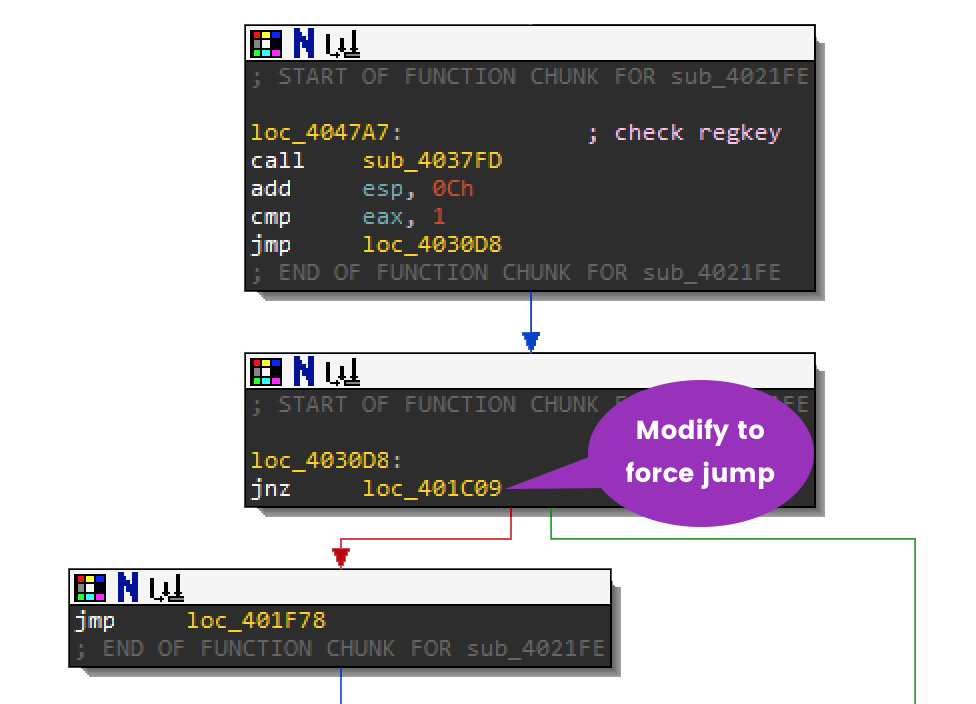
- or Right after
sub_4021FE:
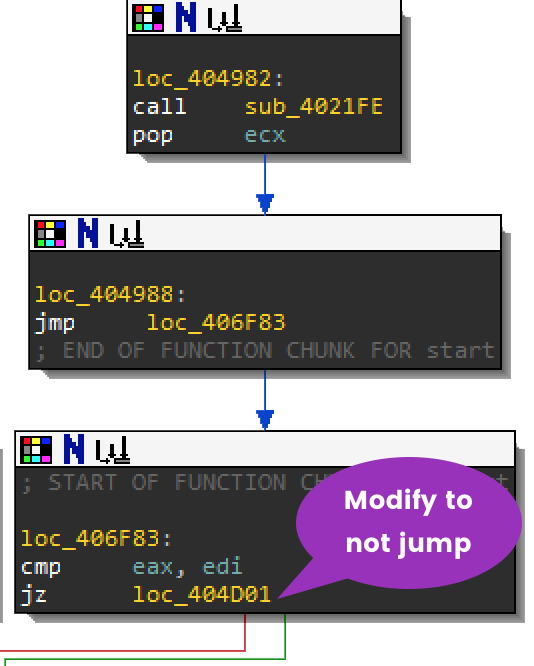
If you modified either of the jump calls above while debugging you should have reached loc_4010FE and sub_4029F1. Below, you can see how to modify the second jump.
Check for VM drivers
Just like the previous functions, the strings pushed to the stack. Look for the instruction call dword ptr [ebx+0B0h]which is where you set a breakpoint at 00405248. In the debugger, this will call GetSystemDirectory which will return %system32%. Keep stepping through this function to get the full paths of the files it is checking for.
- %system32%\drivers\vmmouse.sys
- %system32%\drivers\vmhgfs.sys
- %system32%\drivers\VBoxMouse.sys
- %system32%\drivers\VBoxGuest.sys
Keep stepping through function sub_4029F1 until you get back to 0040110B where jnz sub_401117 and force the jump to sub_401117.
Check for VM DLLs
Step into sub_401117 and keep going through instructions until you reach some interesting immediate values. Go ahead and convert the immediate values at 00405884 into strings.
This function is checking for sbiedll.dll which is a DLL used by the Sandboxie sandbox. If you are working with Vbox, this DLL will not exist so you won't need to bypass the jump. Keep working your way through this function because it's not done with all the checks.
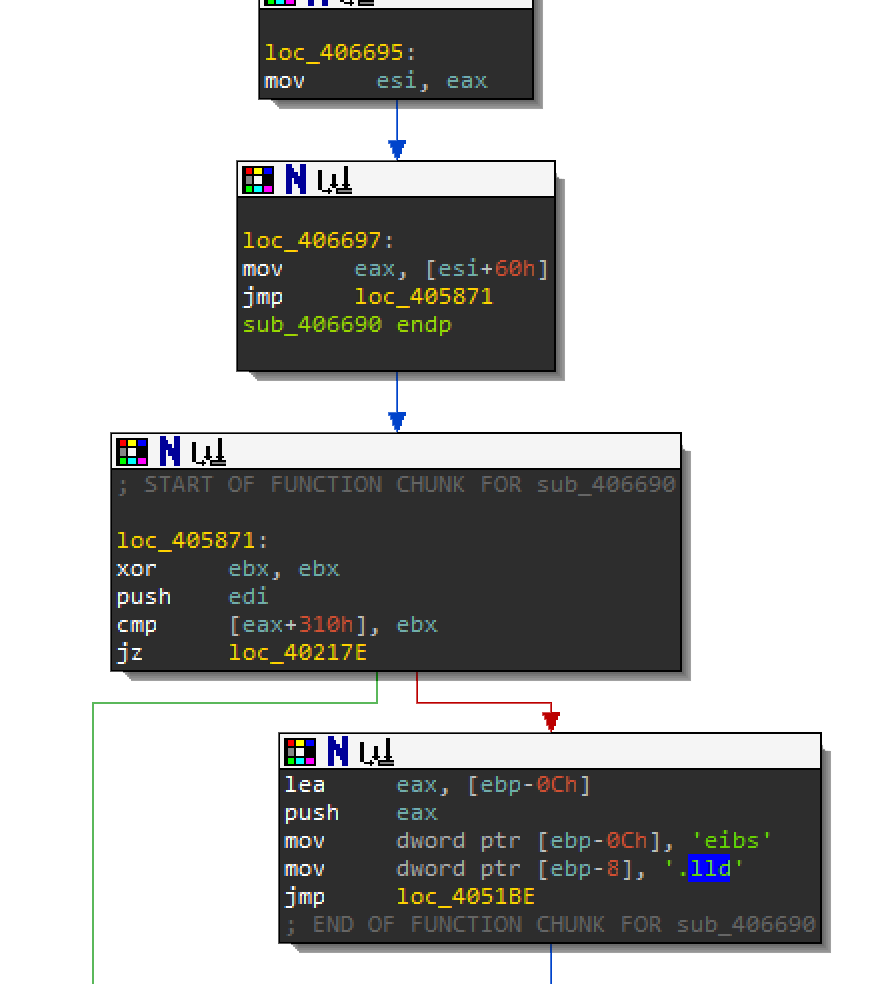
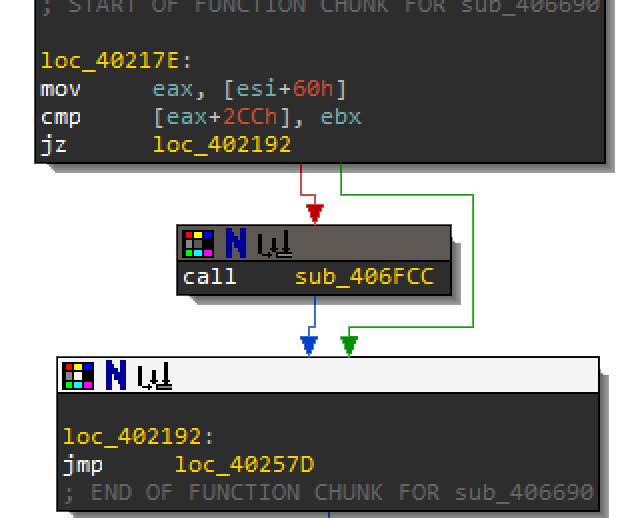
Check the Physical Drive
In IDA, look into sub_406FCC at 0040218D after the sandboxie DLL check. Based on the logic below you might not need to step into this function. You can always force the jump to loc_402192 and skip over sub_406FCC. For the purposes of recognizing VM evasion, you should step through this function.
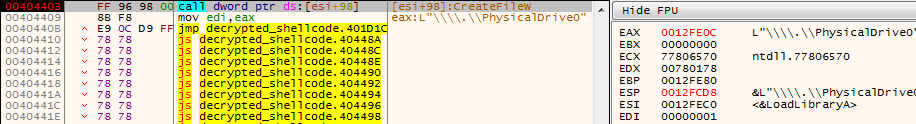
Put a breakpoint at 00404403 where the instruction call dword ptr ds:[esi+98] because this is the next API call. It tries to call CreateFile the PhysicalDrive0 in order to read it.
Because the above check failed, it will perform another device check. Keep stepping through the program until you reach 00406266 where the second API call is call dword ptr ds:[esi+94]. It is calling DeviceIoControl where it will check the \.\PhysicalDrive0 for the following strings:
- qm00001
- virtual
- array
- vbox
- vmware
- 00000000000000000001
Here is the API function as reference:
BOOL WINAPI DeviceIoControl(
  _In_        HANDLE       hDevice,
  _In_        DWORD        dwIoControlCode,
  _In_opt_    LPVOID       lpInBuffer,
  _In_        DWORD        nInBufferSize,
  _Out_opt_   LPVOID       lpOutBuffer,
  _In_        DWORD        nOutBufferSize,
  _Out_opt_   LPDWORD      lpBytesReturned,
  _Inout_opt_ LPOVERLAPPED lpOverlapped
);
After DeviceIOControl is called do not take the jump after at 00405778 or loc_405778. This will cause the device to close and return back to the main function where the sandboxie DLL was checked.

This jump should land you at loc_402192 or 00402192. Congratulations! You have made it past several VM evasion techniques. The next section will go over identifying a packer.
This section will focus on identifying a custom packing routine. Believe it or not this whole shellcode executable is a packer itself. The next several functions will reveal its algorithm, and you will be able to create a simple unpacking script.
The Bat and Vbs Scripts
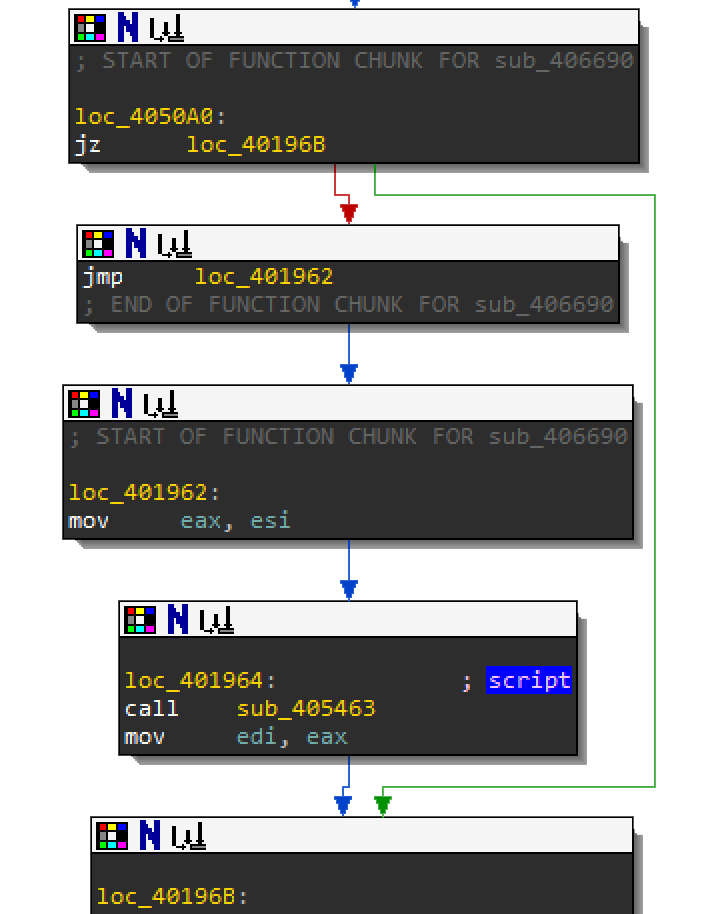
Before you actually get to the unpacking routine, navigate your way to loc_4050A0. There is a function call you might miss. When you are debugging the jump instruction jz loc_40196B at 004050A0 will jump over sub_405463. If you want to debug this function just modify the jump here.
Here is a summary of sub_405463:
- This function allocates memory to store the current filename and
%APPDATA%location to determine if the executable already exists there. The giveaways are:
VirtualAllocSHGetFolderPathGetModuleHandleAGetModuleFileNameWPathRemoveFileSpec
- It will then try to create a process from the file stored in
%APPDATA%, by calling CreateProcess - Create a .bat file in
%APPDATA%where the contents are pushed onto the stack. This file contains the following:
start /d "C:\Users\victim\AppData\<exe filename>" - Where it will write the hidden .vbs script in the location:
C:\\Users\\victim\\AppData\\Roaming\\Microsoft\\Windows\\Start Menu\\Programs\\Startup\\<filename>.vbsThis vbs script contains the following:
Set WshShell = CreateObject("WScript.Shell")
WshShell.Run chr(34) & "C:\\Users\\victim\\AppData\\Roaming\\<filename>.bat" & Chr(34), 0
Set WshShell = Nothing
To see the bat and vbs script get created, force these jump locations to not take the jump branch! This can be done like before, by simply changing the zero flag.
0040308900404652004048A7004048B0004033490040507A
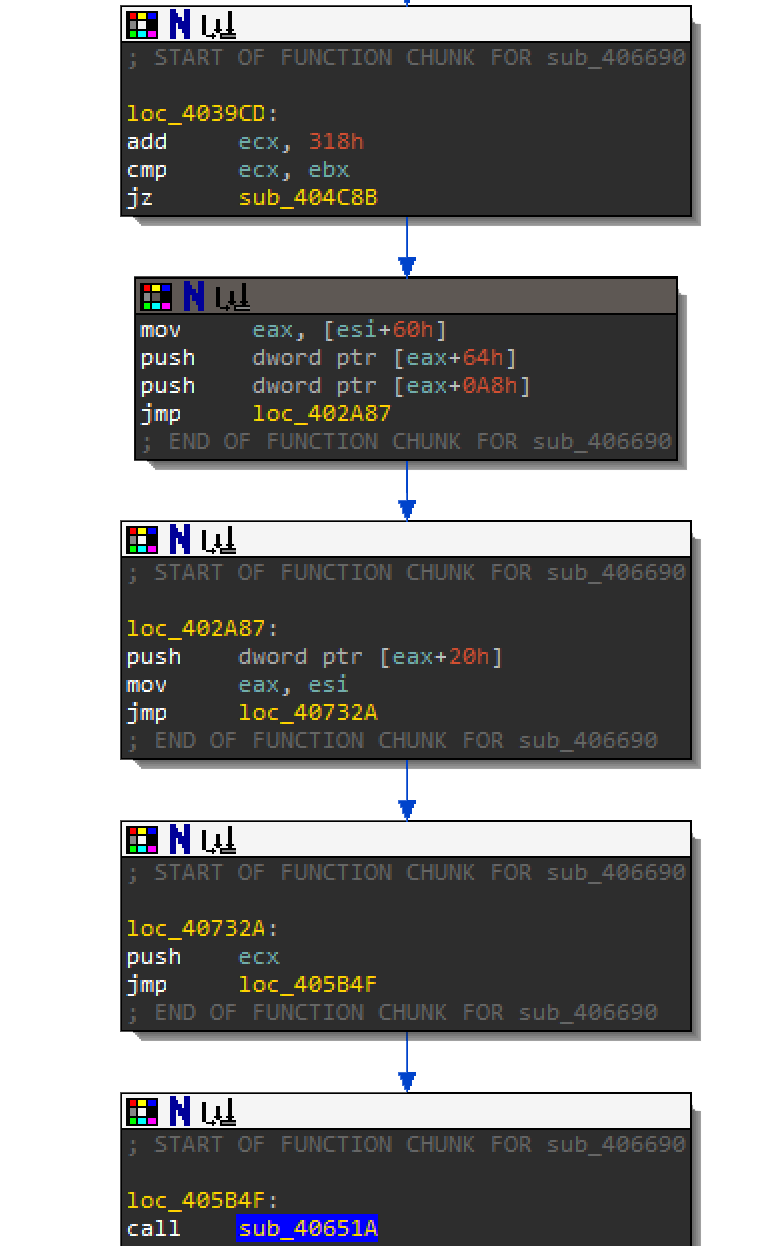
The Unpacker
In IDA, after the call to sub_405463, all paths lead to loc_4057BC. In the debugger, set a breakpoint at 004057BC and run to this location.
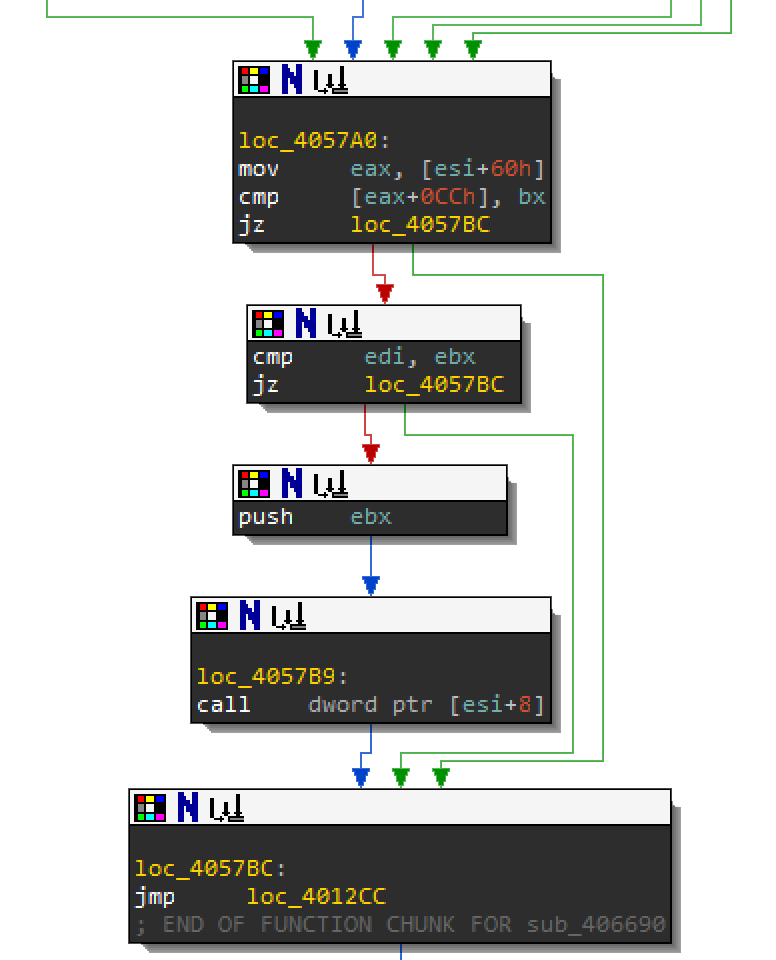
The next routine should look familiar to you. There are multiple values being pushed to the stack before the call to sub_40651A.
- The first pushed value is
[esi+60]which is the location where the first 0x318 bytes of Resource 1000 was decrypted. - The second value is 0x1.
- The third pushed value is one dword at the relative offset
0x64of that0x318bytes. - The fourth pushed value is one dword at the relative offset
0xA8of that0x318bytes. - The fifth pushed value is the original resource stored in memory.
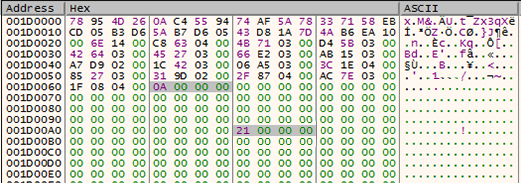
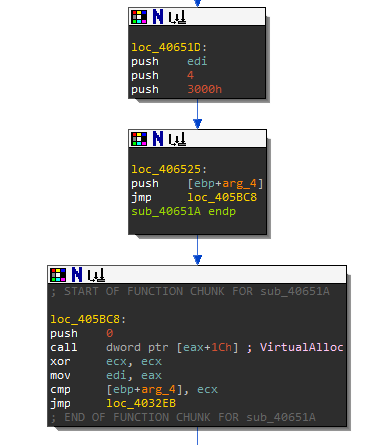
The values for 0x0A (10 decimal) and 0x21 (33 decimal) will become important within function sub_40651A. Step into F7 function sub_40651A. The first part of the function allocates some memory where it will store the output of the next routine. In the debugger, step over F8 the VirtualAlloc call and dump the memory location that it returns so that you can monitor the changes.
In the debugger, step F7 through this loop and keep track how values 10 and 33 are used against the resource bytes.
The 2 dumps below shows what this routine is actually doing: compression. After the initial byte 0x1, it is removing every 10 bytes, displayed as 0xFF below. The routine will then store the next 33 bytes.
Below is an example of what the first loop through the data looks like. All 10 instances of 0xFF were removed.
After you run through the whole function it will return this new compressed code for the next function call. Be sure to dump this section of memory as a .bin file and name it compressed.bin. You should have correctly renamed the RC4 function from earlier in IDA. After function sub_40651A, there should be a call to the RC4 decrypt function at 00407165.
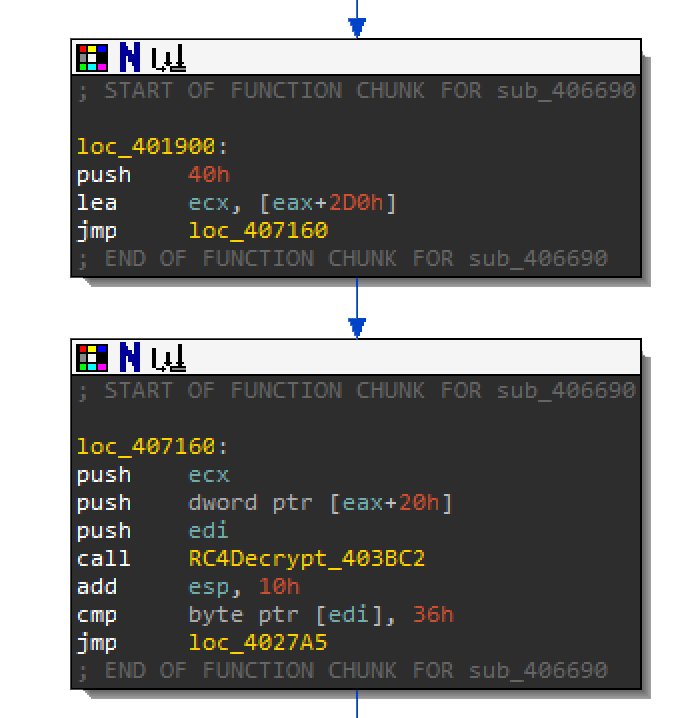
If you remember from earlier, the key size was 0x20. For this call to RC4Decrypt, the key size is 0x40h at offset 0x2D0 of the decrypted 0x318 bytes. Below is the RC4 key:
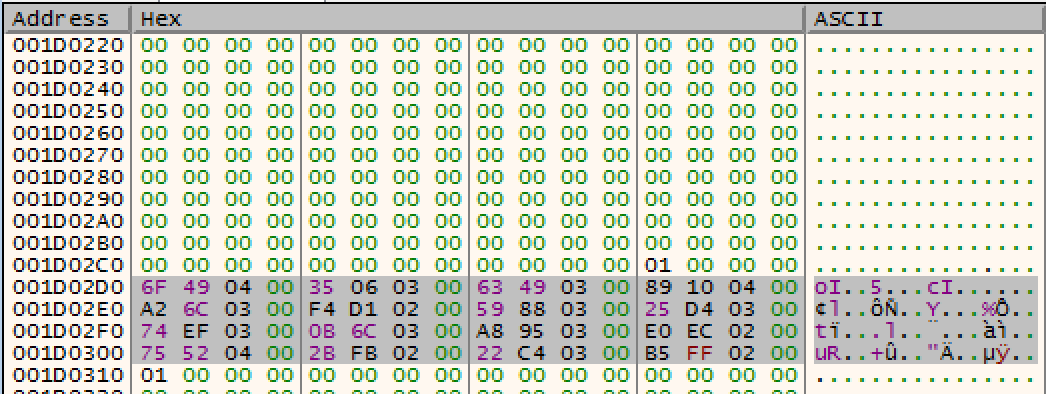
6F 49 04 00 35 06 03 00 63 49 03 00 89 10 04 00 A2 6C 03 00 F4 D1 02 00 59 88 03 00 25 D4 03 00 74 EF 03 00 0B 6C 03 00 A8 95 03 00 E0 EC 02 00 75 52 04 00 2B FB 02 00 22 C4 03 00 B5 FF 02 00Export this key as a binary file and use the decrypt_shellcode.py script against the compressed.bin and the key.bin.
c:\Python27\python.exe <location>\decrypt_shellcode.py <location>0x40key.bin <location>\compressed.binIn the debugger, you can step over F8 the RC4Decrypt function and watch the compressed code change to the output below:
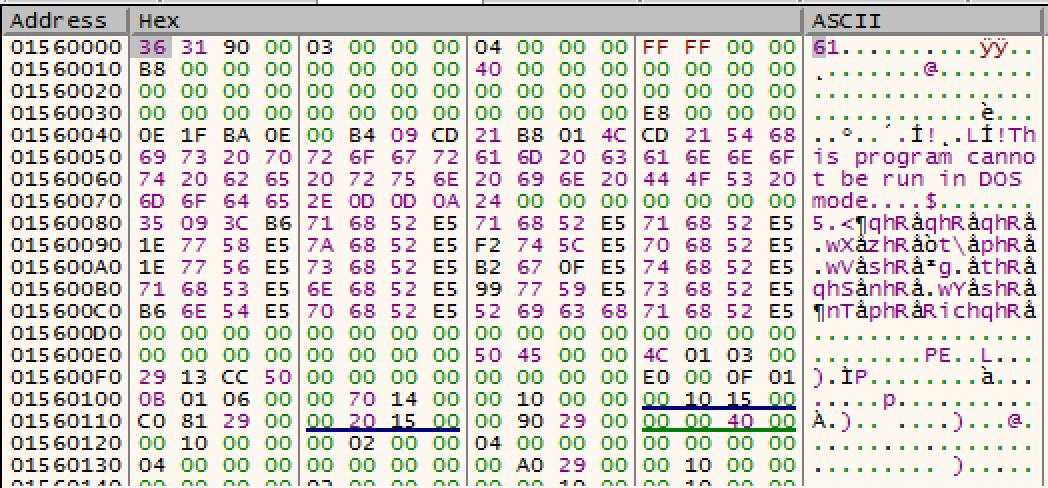
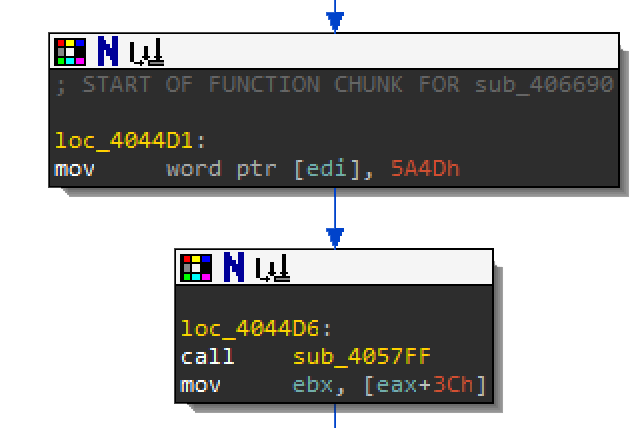
Notice that the output looks like the header of a PE executable. The only difference is that it is missing the MZ header. If you scroll down after the RC4Decrypt function you will see the immediate value 0x544D which is MZ. This is where it will add the MZ header.
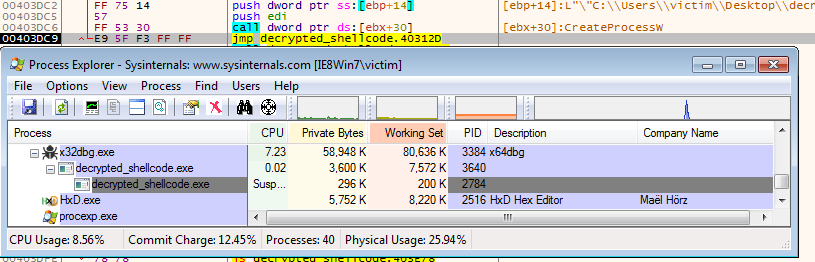
Step through the rest until you reach a call to sub_4031A9 at 00404C81. You will find that it uses CreateProcess to spawn a new process of the newly created PE without dropping it to disk. After you step over the call to CreateProcess, you can open Process Explorer to view the newly created child process.
Now that you know the algorithm, you can create an unpacking script for the resource. The next page will go over the script.
Here is the full unpacking script. Extract the raw resource 1000 as a binary file as the first argument. It will output the exe as decrypted_payload.exe.
import os
import sys

# key sizes
key1size = 32  # 0x20
key2size = 64  # 0x40

# offset to key2
key2_offset = 720  # 2D0

# offset to payload
payload_offset = 792  # 0x318

# offset to first instruction
junk_char_length_offset = 100  # 0x64
good_char_length_offset = 168  # 0xA8

# header bytes
header = 'MZ'


def key_schedule(_key):
    key = _key
    if not isinstance(_key, list):
        key = list(_key)
    keylength = len(key)
    S = range(256)
    j = 0
    for i in range(256):
        k = key[i % keylength]
        if not isinstance(key[i % keylength], int):
            k = ord(key[i % keylength])
        j = (j + S[i] + k) % 256
        S[i], S[j] = S[j], S[i]  # swap
    return S, j


def RC4_decrypt(_key, _enc):
    result = []
    S, j = key_schedule(_key)
    enc = _enc
    if not isinstance(_enc, list):
        enc = list(_enc)
    m = len(enc)
    i = 0
    for c in enc:
        i = (i + 1) % 256
        j = (j + S[i]) % 256
        S[i], S[j] = S[j], S[i]
        k = S[(S[i] + S[j]) % 256]
        m -= 1
        if not isinstance(c, int):
            result.append(ord(c) ^ k)
        else:
            result.append(c ^ k)
    return result


def deflate_payload(junk, good_data, _data):
    data = list(_data)
    new_data = []
    j = 0
    k = 0
    new_data.append(ord(data[0]))
    i = 1
    while i < len(data):
        if j != junk:
            j = junk
            i += j
        if j == junk:
            if k < good_data:
                new_data.append(ord(data[i]))
                k += 1
                i += 1
            else:
                j = 0
                k = 0
    return new_data


with open(sys.argv[1], 'rb') as encrypted_file:

    # Get the file size
    file_size = os.path.getsize(sys.argv[1])

    # Get the first key of 0x20 bytes
    key1 = encrypted_file.read(key1size)

    # Get the start of deflate instructions
    encrypted_info = encrypted_file.read(payload_offset - key1size)

    # Get the bytes for the payload
    encrypted_payload = encrypted_file.read(file_size-payload_offset)

    # 1. Decrypt the deflation instructions
    decrypted_info = RC4_decrypt(key1, encrypted_info)

    # 2. Get instructions from the decrypted data
    junk_char_length = decrypted_info[junk_char_length_offset-key1size]
    good_char_length = decrypted_info[good_char_length_offset-key1size]

    # 3. deflate payload
    deflated_payload = deflate_payload(junk_char_length, good_char_length, encrypted_payload)

    # 4. get key2
    key2 = []
    for i in range(key2size):
        key2.append(decrypted_info[(key2_offset-key1size)+i])

    # 5. decrypt enc3
    decrypted_payload = RC4_decrypt(key2, deflated_payload)

    # 6. fix header
    for i in range(len(header)):
        decrypted_payload[i] = ord(header[i])

    # write to file
    with open("decrypted_payload.exe", 'wb') as out:
        for i in decrypted_payload:
            out.write(chr(i))
        out.close()
This concludes the workshop but you can apply the same unpacker to the resources in this malware. The payload exe is:
- UPX packed
- Has 3 resources using the same packer
As an exercise, I recommend going through them on your own.
Most custom packers are bought and sold on underground forums or traded amongst malware authors. The following sample called Rombertik uses this same packer. For fun you can check it out:
77bacb44132eba894ff4cb9c8aa50c3e9c6a26a08f93168f65c48571fdf48e2aThis concludes workshop RE102. I hope you enjoyed the levels of obfuscation and evasion. Here is a summary of what the malware's packer does.
8be8abab0f3ebcc18e7b8b3c437feb073fa7b9b30e8b1eef81451f0938b2a52aThe purpose of this workshop was to get you familiar with Anti Reverse Engineering, Encryption, VM Evasion and Packing techniques. As you saw this malware's packer had multiple layers of shellcode and tricks to throw off a reverse engineer. But by breaking things down step by step, you were able to work your way through each challenge.
Special thanks to all my former interns.